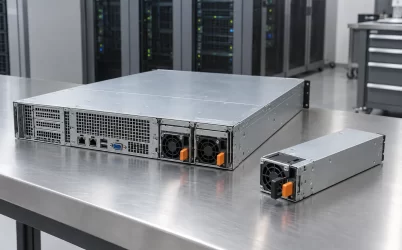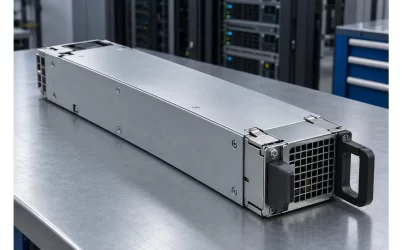
A 1200W Platinum server PSU does not normally draw 1200W from the wall. The wattage is an output-capacity label; the electricity taken from the rack feed depends on the server’s actual DC demand and the supply’s efficiency at that operating point. A chassis carrying two such modules adds another complication: its normal and single-failure states can put each converter at very different loads. For a facilities engineer, the practical question is not whether the label says 1200W, but what AC input, heat, and upstream capacity a particular server configuration will require over time.
Start with the DC load, not the PSU nameplate
Suppose a server’s motherboard, accelerators, drives, fans, and local regulators collectively ask the PSU system for 600W of DC output during a representative workload. A 1200W-rated module has theoretical output headroom at that moment, but the server is not consuming its nameplate rating. If the same hardware reaches 900W during a different job, its AC draw rises even though the PSU’s printed wattage has not changed. A rack-power estimate based on the PSU label alone would overstate the first condition and might still miss a short peak, an input-voltage derating rule, or a later hardware expansion.
The boundaries of the 600W figure matter. A board-level measurement at the CPU rail is not the same as DC power leaving the PSU: losses in voltage regulators, board traces, cables, and distribution components lie between them. A server management controller may report component estimates or a PSU input reading, depending on the platform. Use the measurement’s documented location before inserting it into an efficiency calculation. Combining a downstream CPU estimate with a whole-PSU efficiency value as if it represented all DC output produces a falsely precise AC number.
A real 1200W module can also have different permitted outputs at different feed voltages or inlet temperatures. Gospower identifies G1136-1200WNA in its P185 Platinum CRPS family, but its public summary does not provide a controlled exact-model current table or verify all the numerical fields in the Powernexu product listing. Therefore, that listing is a candidate reference rather than an input for the calculations here. The host’s approved module list, installed backplane, and model-specific operating document determine the usable configuration and efficiency curve.
Conversion loss is the bridge between DC output and the rack feed
For one operating point, AC real power is approximately DC output power divided by conversion efficiency: PAC = PDC / η. The difference, PAC − PDC, is power lost in the conversion process. At an assumed 92% efficiency, delivering 600W DC needs about 652W AC and creates about 52W of converter loss. At an assumed 90%, the same output needs about 667W AC and creates about 67W of loss. These are transparent arithmetic examples, not measured values for the linked Powernexu model.
Efficiency is not a single constant attached to every operating state. It changes with output load, input voltage, temperature, and sometimes the way multiple modules share current. Therefore, the 92% example should never be copied into an energy model without evidence that the selected PSU achieves approximately that value at the relevant load and feed. The official 80 PLUS efficiency-category explanation distinguishes test categories and load points. A Platinum designation identifies a class of tested efficiency performance under the applicable program conditions; it is not a live measurement of this installed server and does not by itself establish a flat 92% curve from idle to full output.
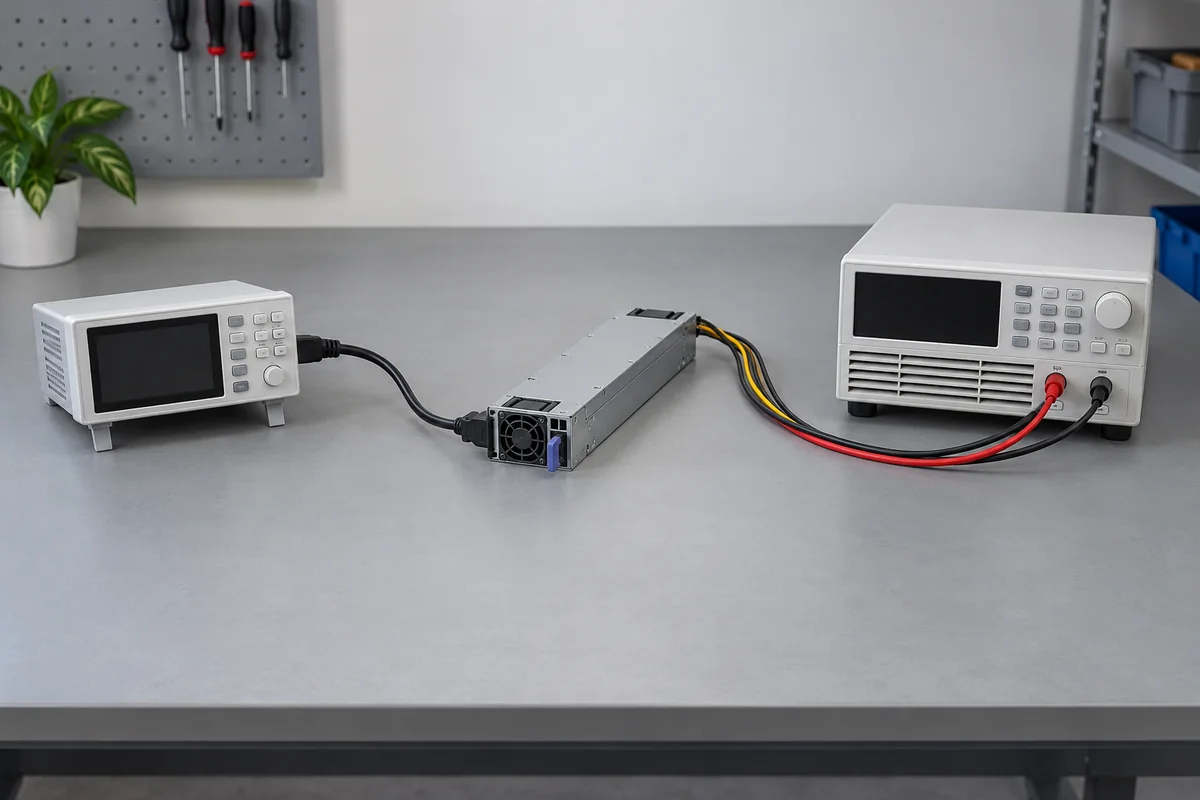
The arithmetic can be reversed when an actual AC reading is available. If a meter at the server inlet shows 700W and a validated PSU telemetry reading shows 630W DC output at the same instant, the implied system-level conversion ratio is 630/700, or 90%. That ratio is useful only if the two instruments cover the same time window and electrical boundary. A rack PDU feeding several servers cannot isolate one PSU; a BMC number averaged over a longer interval cannot be compared fairly with a short AC spike. An apparent discrepancy may be a metering mismatch rather than a failing converter.
It is also easy to count heat twice. Almost all electrical power consumed by a server eventually becomes heat in the IT space, apart from small amounts carried away through other paths. PSU conversion loss adds to the server’s total AC draw for the same delivered DC work; it does not form a separate heat load on top of the already counted AC input. In the 600W examples, a fifteen-watt difference in converter loss is approximately a fifteen-watt difference in rack electrical demand and eventual room heat, assuming the downstream work remains the same.
A 1+1 pair changes the per-module operating point
Imagine a server designed to keep running after one of two 1200W modules fails. During ordinary operation, both modules may share a 600W DC load, but the exact split depends on the platform and its current-sharing controls. If they share evenly, each converts roughly 300W: one-quarter of its 1200W rating. When one module is removed, the survivor must deliver the full 600W, or half its rating. That change can move the supply to a different region of its efficiency curve, alter its fan speed, and concentrate loss near one exhaust path.
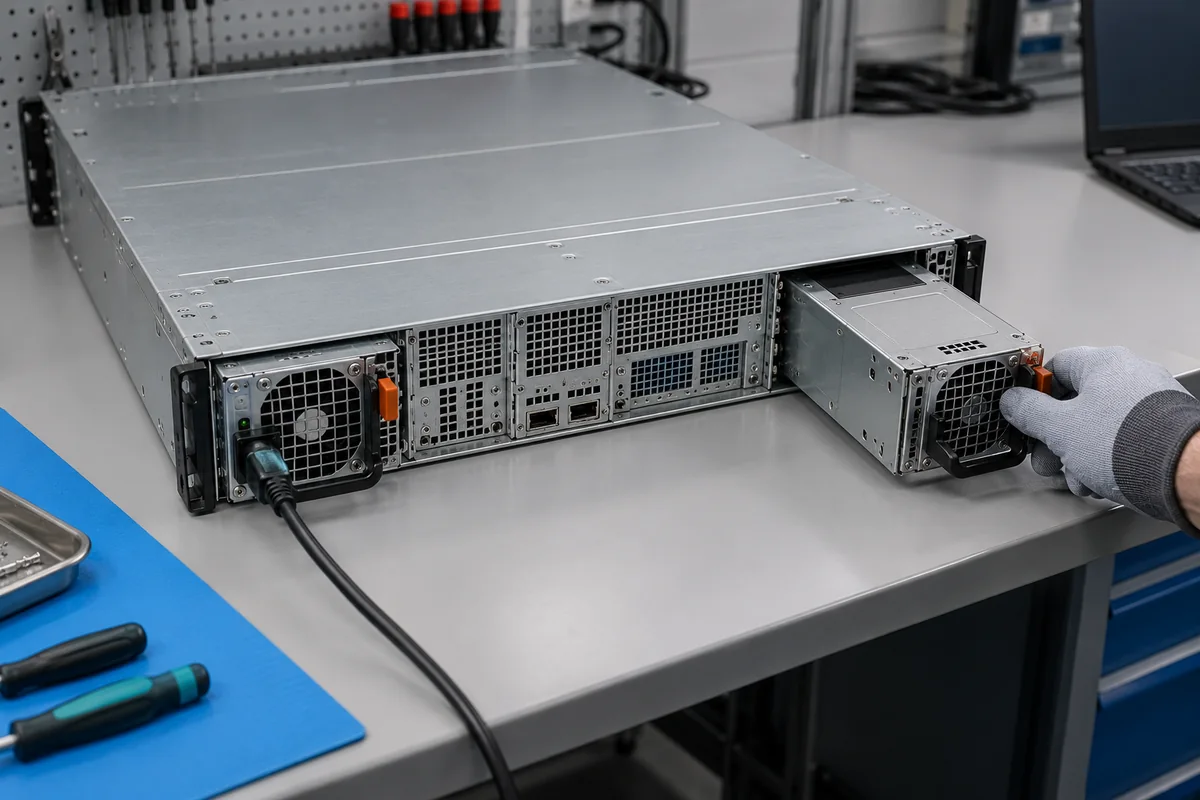
The normal-state AC draw of two converters is not necessarily the AC draw predicted by treating them as one larger converter. For illustration only, suppose the pair’s combined efficiency while each carries 300W is 88%. Supplying 600W DC then needs about 682W AC. Suppose the surviving module’s efficiency at 600W rises to 92%; the failed-state electrical input would be about 652W AC while the server load remains the same. This example shows why identical output demand can produce different input readings. It does not predict the behavior of any specific PSU, and a real platform may change workload or fan demand after a failure.
The purpose of 1+1 redundancy is continuity, not an assurance that two nameplates may be added into a 2400W protected capacity. If the platform requires the entire 1200W output from one module after a failure, the single module’s input conditions, thermal environment, connector contacts, and distribution board must all support that state. If peak demand exceeds what one module can provide, the host may have a documented power cap or may not maintain full performance. An energy estimate that assumes balanced operation forever misses the state for which the redundant architecture was bought.
Some systems can use policies that change the number of actively converting modules at low load, while others keep both modules operating. Neither behavior should be inferred from the CRPS shape or from the Platinum label. The server’s control design determines whether a module can be parked, what standby power remains, how wake-up is handled, and whether redundancy is still available at the instant of a fault. When comparing rack-energy measurements, identify which policy was active rather than assuming all dual-module chassis behave alike.
Translate one server’s watts into an annual energy range
To estimate energy, multiply average AC real power by operating time. A sustained 15W conversion-loss difference over 24 hours is 0.36kWh; over 365 days it is about 131kWh per server. Ten identical servers at the same average condition would multiply that difference to about 1,314kWh per year. The calculation is straightforward, but the assumption of a fixed workload for every hour is usually the weak part. If the server spends nights at a lower load, the efficiency difference must be evaluated there too. If it spends a few hours a day near maximum output, those hours need their own input estimate.
A better energy model uses several observed operating states. For example, a node might spend 50% of the year at one DC load, 35% at another, and 15% in a high-load processing window. Convert each state with the efficiency applicable to that state, then weight by its hours. This is not a demand for a universal three-row worksheet: a nearly constant storage server may need very few states, while a training node with long idle periods and short intensive jobs may need more. The split should reflect the actual work rather than a standard-looking spreadsheet.
Cost can be calculated only after choosing the tariff and the metering boundary. Multiplying PSU AC kWh by an electricity price gives an IT-input energy estimate, not necessarily the full facility bill. A UPS, rack PDU, distribution transformer, and cooling plant have their own losses. Facility-level overhead may change with the additional server heat, but it should not be represented as a fixed universal multiplier without site data. Conversely, comparing two supplies at the same delivered workload lets the incremental AC-input difference be estimated without modeling every facility device from scratch.
Idle behavior deserves attention because servers remain powered between useful jobs. A 1200W output rating says almost nothing about the AC input of a lightly loaded server. Management circuitry, fans, memory, storage, and downstream regulators continue to consume energy. At low DC output, fixed PSU overhead may take a larger share of input power. A purchasing comparison that highlights only a high-load efficiency value can miss the operating region in which the system actually spends most of its hours.
Real power, apparent power, and circuit capacity are different numbers
The AC watts derived from efficiency describe real power. Branch circuits and upstream equipment also experience current and apparent power, which depend on voltage and power factor. For an idealized single-phase calculation, apparent power in volt-amperes is approximately real watts divided by power factor, while current is apparent power divided by voltage. If a 652W real-power input had a 0.95 power factor on a 120V feed, the simple steady-state estimate would be about 686VA and 5.7A. These assumed values illustrate the distinction; they are not the published input current or power factor of a particular server.
Do not use that steady-state estimate alone to choose a breaker, UPS, or PDU outlet. The selected equipment’s input-current specification, inrush behavior, feed voltage, power cord and connector rating, upstream diversity rules, and local electrical requirements still apply. An IT engineer looking only at a PSU’s 1200W output could underestimate AC input near maximum delivery; a facilities engineer sizing every outlet as though every installed server continuously draws its PSU nameplate could oversize infrastructure without learning the real demand profile.
Input voltage can influence both conversion efficiency and permitted output. A product that accepts a wide input range is not necessarily allowed to deliver its maximum nameplate output at every point in that range. Where a deployment includes 120V and 230V racks, treat those as separate operating conditions unless the actual PSU documentation says otherwise. The same server may have different available headroom, input current, and efficiency on different feeds. The label “Platinum” does not erase those model-specific constraints.
What the rack can learn from a 1200W Platinum label
The label establishes a capacity class and a useful efficiency category, but it is not a rack-energy forecast. The forecast comes from the server’s delivered DC work, the installed module’s efficiency at that load and feed, the number of active modules, and the hours spent in each state. A first pass can be made with explicit assumptions such as the 600W and 92% calculation above. A defensible operating estimate improves it with the selected model’s documented curve or coincident AC and DC measurements.
That approach keeps three decisions separate. The chassis and module interface determine whether the supply is physically and electrically suitable. The single-module capacity determines whether the required workload survives a fault. The efficiency curve and workload history determine the energy and heat consequences. A 1200W Platinum server PSU may be the right module for a particular host, but the words on its label cannot substitute for any of those three system facts.