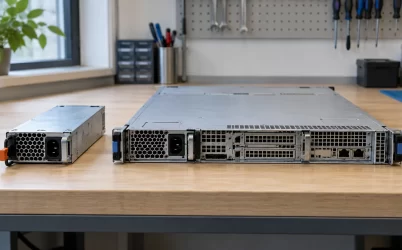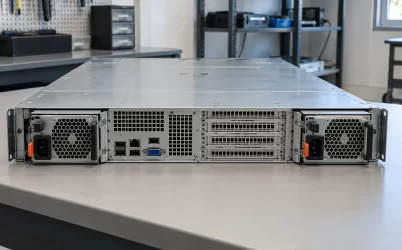
The CRPS3200CL5 is a 3,200 W, 54 V, Titanium-class server power module in a 265 × 73.5 × 40 mm body. The useful distinction from another 54 V module with the same headline power is its documented efficiency behavior: an exact-model 80 PLUS report measured 96.47% at half load and 95.66% at full load under a 230 V nominal, 60 Hz test. Those figures describe a particular laboratory condition, not a guarantee for every rack feed or ambient temperature. For a buyer comparing operating energy and heat, the report is valuable evidence. For a designer assigning the four catalog output-current values to facility feeds, the published record still leaves a gap.
Two records answer different CRPS3200CL5 questions
Great Wall Power’s CRPS3200CL5 product listing gives the model identity, 3,200 W rating, 54 V output, 2 A at 12 V standby, 265 mm body length, FR airflow designation, 0–55°C operating range, and Titanium classification. It lists main-output currents of 24.1, 48.2, 53.8, and 59.3 A. These are alternative published rating points, not four rails that can be loaded at once. The page does not connect each current value to an input voltage, ambient condition, or other test limit. Its input-voltage field is empty.
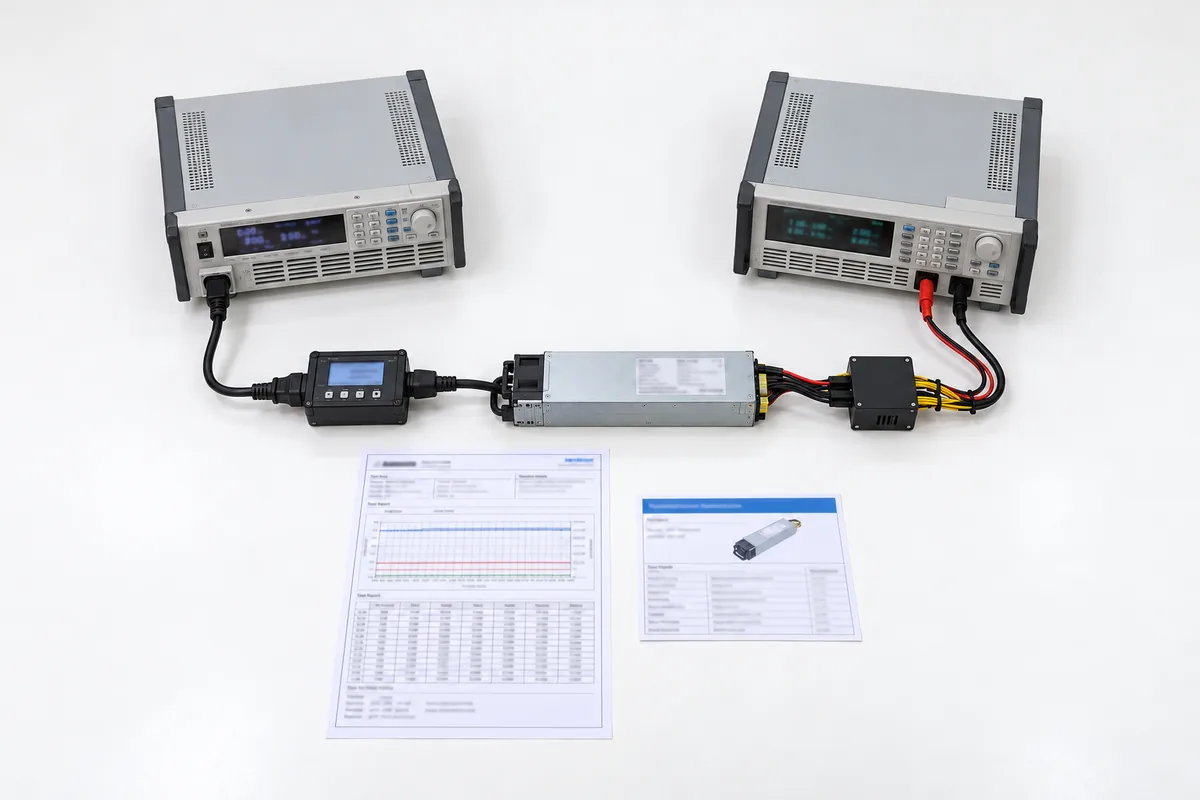
An exact-model 80 PLUS verification report adds something unusually useful for this lookup: measured AC input and DC output at four load fractions. It names CRPS3200CL5 and identifies a 3,200 W rated output. Its rated-specification block shows AC voltage bands of 100–127, 200–220, and 220–240 V, with 16 A listed for each band. The measurements themselves were taken at 230 V nominal and 60 Hz. The report thus supports an efficiency discussion at that test condition; it does not establish full-output availability across every listed voltage band, nor does it document a DC-input option.
The two sources should not be flattened into one invented specification. The catalog’s blank input cell remains an unresolved product-page omission. The 80 PLUS report describes a tested sample and rated AC bands, but it contains no table assigning 24.1, 48.2, 53.8, or 59.3 A to those bands. A system bill of materials needs the ordered revision’s electrical specification to settle that relationship. The distinction matters because 24.1 A at a nominal 54 V is about 1.30 kW, while 59.3 A is about 3.20 kW. Treating both as universally available would hide a large capacity difference.
The measured curve is more informative than the Titanium label
Efficiency is output power divided by input power under defined test conditions. The independent report records 340.85 W output from 369.99 W input at its 10% point, or 92.12%. At 20%, it records 640.25 W output and 673.08 W input, or 95.12%. Its 50% point is 1,601.42 W output from 1,660.01 W input, yielding 96.47%. At the nominal full-load point, the measured 3,210.27 W output and 3,355.84 W input yield 95.66%. The measured output is slightly above the rounded 3,200 W rating because these are actual laboratory readings.
| Reported load point | Measured DC output | Measured AC input | Efficiency | Input minus output |
|---|---|---|---|---|
| 10% | 340.85 W | 369.99 W | 92.12% | 29.14 W |
| 20% | 640.25 W | 673.08 W | 95.12% | 32.83 W |
| 50% | 1,601.42 W | 1,660.01 W | 96.47% | 58.59 W |
| 100% | 3,210.27 W | 3,355.84 W | 95.66% | 145.57 W |
The last column is a direct subtraction from the report, not a separate calorimetric measurement of the module. It helps estimate conversion loss at each tested load. The report explicitly notes that external fan power is excluded from its efficiency calculation. A real chassis can also add PDB contact loss, bus-bar loss, local-converter loss, and its own cooling power. Those downstream and system-level amounts are outside this test. Consequently, the 145.57 W figure should not be promoted to a total rack cooling requirement, although it makes clear that full-load conversion loss is materially higher than at half load.
Notice the curve’s shape. Efficiency rises sharply between 10% and 20%, peaks among these reported points at 50%, and declines modestly at 100%. This is why a Titanium badge cannot replace an operating-point estimate. A server sitting at 600 W for long periods does not experience the same percentage efficiency as a server drawing more than 3 kW. Conversely, a module that operates near half load may convert a higher percentage of AC input into DC output, while absolute watts lost can still exceed those at a lighter load. Percentage and heat load answer different questions.
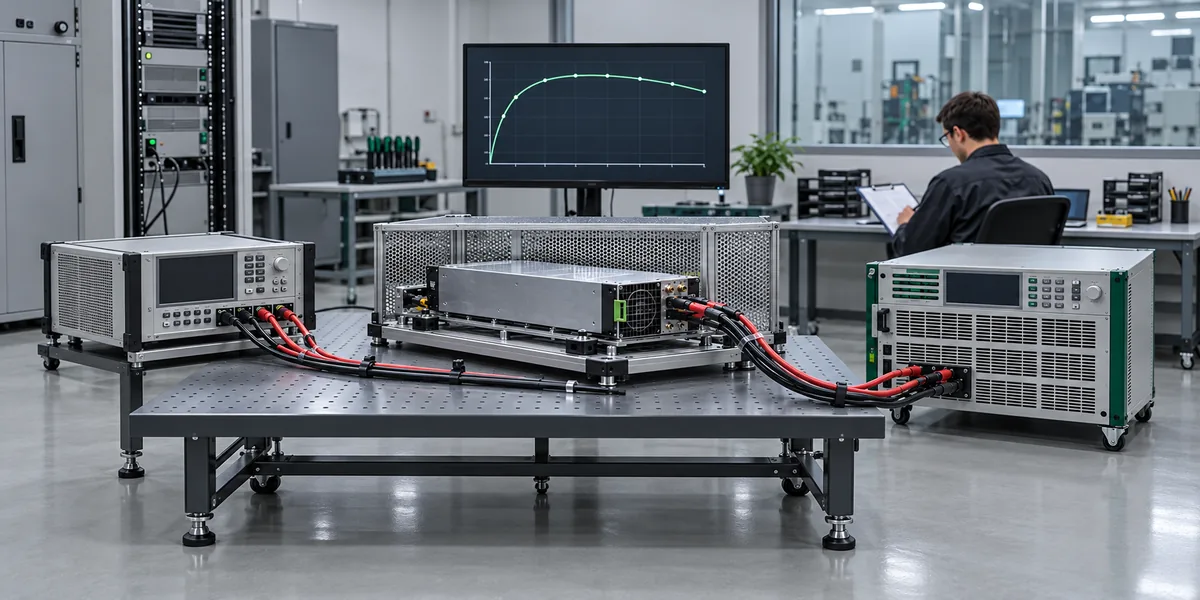
For energy planning, use a workload distribution rather than one convenient point on the curve. If an accelerator node spends substantial time at idle, training, and burst levels, estimate hours in each band, use measured or defensibly interpolated power conversion data, and keep the unmeasured conditions visible. The four report points do not give a continuous curve, a temperature sweep, or a low-line efficiency test. Interpolation between them can support a preliminary estimate, but extrapolating the 230 V test to another input band as an exact result would exceed the evidence.
Full-load AC draw is a measured condition, not a branch-circuit label
At the report’s full-load test, input power was 3,355.84 W at 230 V nominal. The reported RMS input current was 14.598 A, while the rated-specification block lists 16 A in each AC voltage band. These statements do different jobs. The measured current describes one sample at one test point. The 16 A value is a stated input-current rating in the report. Neither number independently proves that a particular PDU outlet, cord, breaker, and connector are suitable for a deployed rack under its electrical code and continuous-load rules.
The 230 V result also should not be scaled linearly to 100 V as a promised operating point. Input current can change with voltage, power limiting, and conversion losses; the manufacturer catalog gives no mapping from AC input to its four output-current tiers. Under a lower-voltage feed, a capacity limit may become decisive before the 3,200 W headline is available. The report’s rated voltage bands confirm that the model was documented for AC bands, but they do not fill the missing output-versus-input matrix. Ask for that matrix before using the highest current value in a low-line rack plan.
Where a server has two redundant power modules, the relevant facility question is what one surviving module can deliver on the actual feed after its partner is removed or faults. The answer requires the permitted output at that feed and ambient temperature. Adding two 3,200 W labels would instead describe a sum of nominal ratings, not protected server capacity. This article does not need a generic redundancy topology to make the point: any energy or heat comparison that assumes full output during failover must first establish the surviving module’s actual allowed operating point.
The 54 V measurements identify the electrical boundary
The 80 PLUS report provides output terminal readings as well as overall power. Its full-load 54 V entry is 53.97 V at 59.04 A. Their product is approximately 3.19 kW; the report’s total output also includes the measured standby output. This confirms that the sample was tested as a 54 V main-output unit, not a 12 V server PSU with an equivalent wattage label. The report also records 12 V standby values separately. The standby rail is for auxiliary control loads within its stated 2 A rating and does not replace the high-power 54 V bus.
At roughly 59 A, a 54 V distribution path has to be designed for the actual contacts, conductors, and downstream converter inputs. A matching voltage number does not prove connector compatibility. A server that expects a 12 V input at its PDB would need an appropriate conversion architecture; the CL5 cannot be interpreted as a mechanically convenient 12 V substitute. This distinction has been covered more broadly in the CRPS3200TS5 product record, which identifies a shorter 185 mm, 54 V model; Great Wall’s official CRPS series listing independently confirms those dimensions and output identity. Here the useful comparison is that equal headline power and output voltage still leave different envelopes and potentially different host interfaces.
Great Wall’s listed 24.1, 48.2, 53.8, and 59.3 A figures correspond to approximately 1,301, 2,603, 2,905, and 3,202 W if multiplied by nominal 54 V. That arithmetic helps a planner understand the scale of each published point. It does not tell the planner which point applies to 100–127 V AC, 200–220 V AC, 220–240 V AC, or any other source. Nor does the efficiency report disclose a production connector pinout, control protocol, current-sharing interface, or supported PDB. The electrical boundary must be closed with the drawing and datasheet for the specific hardware revision.
A long module changes the thermal location of those losses
The 265 mm length is 80 mm greater than the 185 mm CRPS3200TS5 enclosure stated on Powernexu’s product page. The earlier long-body CRPS3500CL5M article explores the mechanical bay implications in depth; the CL5 has a different practical question. If the same rack workload is served at different points on the measured efficiency curve, where does the resulting converter heat enter the host airflow? The published FR designation and 0–55°C operating range do not define the exact inlet temperature, pressure drop, or rating available in a particular chassis.
A 145.57 W input-output difference at the full-load test is significant heat in a narrow 73.5 × 40 mm cross section. The longer module can place internal loss sources farther into the chassis than a shorter body, but the public record does not locate those sources or quantify their temperatures. A thermal review should therefore measure the PSU inlet and exhaust under representative fan-control states and operating loads. Measuring rack-room air alone could miss a warm local inlet caused by recirculation or a neighboring high-power module.
At lower loads, the relationship is less obvious than the Titanium badge suggests. The 50% test loses 58.59 W while delivering about half the output power of the full-load test. That is a smaller absolute heat source, although its percentage efficiency is higher. For a chassis with several installed PSUs, load sharing can move each module to a different part of its efficiency curve. The resulting total loss depends on the actual sharing behavior, standby overhead, fan behavior, and any capacity reserve. This test report alone cannot identify the most efficient module count for a live shelf.
What the report can settle for procurement
The exact-model report supports a narrow, valuable conclusion: a CRPS3200CL5 sample achieved Titanium compliance and the stated efficiencies at 230 V nominal, 60 Hz on the report’s test date. It gives measured input, output, power factor, and current at the listed load fractions. That is stronger evidence for an energy discussion than repeating “Titanium” without a test condition. The report does not certify a whole server, validate a current production revision’s behavior at every feed, or predict an installed rack’s total electrical consumption.
The manufacturer and Powernexu catalog entries provide the form factor, nominal output identity, airflow designation, temperature range, and listed current points. They leave input-to-output mapping and host interface details unresolved. For a 230 V rack with a supported 54 V PDB and a bay designed for a 265 mm module, the CL5 is a meaningful candidate for further engineering review. For a low-line rack, a 185 mm power cage, or a 12 V distribution board, the public facts are insufficient to approve it as a replacement. A purchase order should identify the model and revision alongside the input-rating table and mating-interface drawing the host design actually uses.