Open-frame power supply efficiency is the DC output power divided by the electrical power entering the converter at a stated operating point. The missing power becomes loss, largely heat inside the equipment that contains the exposed board. A quoted peak percentage tells an equipment designer little until the input voltage, actual load, output configuration, and cooling condition are known. The useful comparison is the heat and input energy produced by each candidate across the machine’s real operating profile—not which datasheet prints the largest isolated percentage.
Measure power on both sides of the same converter boundary
The basic ratio is efficiency = DC output power / electrical input power. For an AC-DC board, input power is real AC power at its input terminals under the specified condition; output power is the sum of the DC power delivered by all outputs included in that efficiency claim. Voltage alone is not power. A credible measurement also records current and operating state on each relevant rail. If a supply has a standby output, its contribution or exclusion should be clear rather than silently omitted.
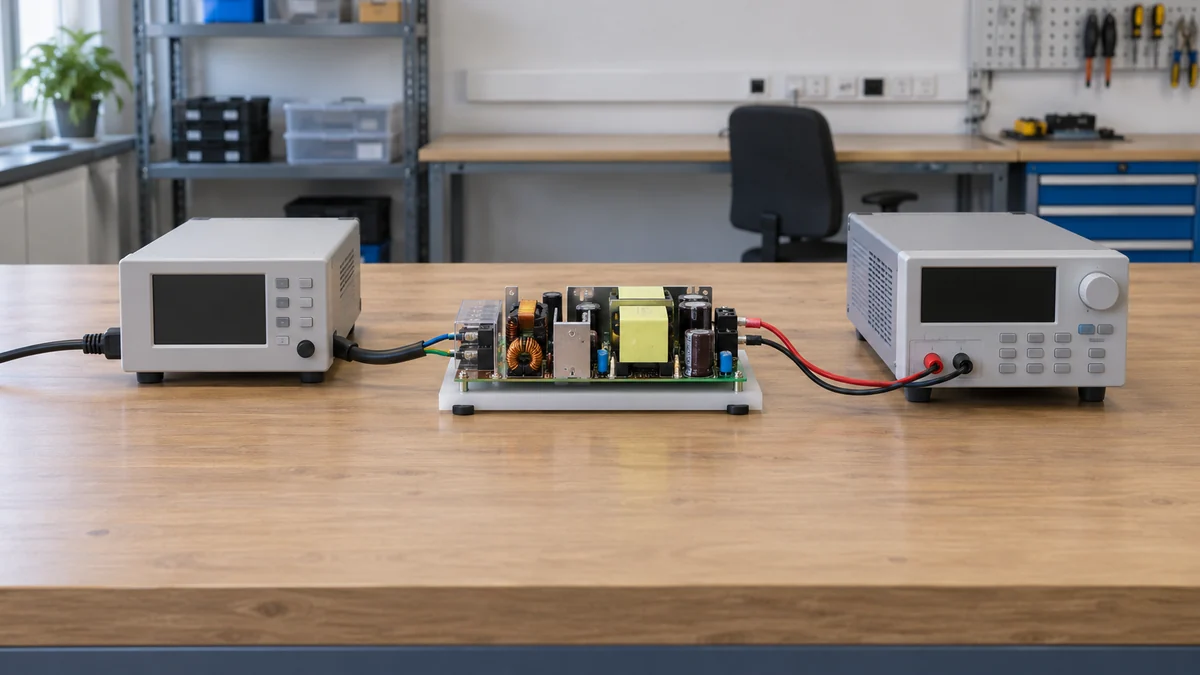
Input volt-amperes are not the same as watts when power factor is below unity. Multiplying RMS input voltage by RMS current gives apparent power; a suitable power analyzer measures real power. Using apparent power as the efficiency denominator can make a converter appear less efficient for the wrong reason. Conversely, reading a DC meter at the load instead of at the PSU terminals adds cable and connector losses to the measured path. That may be useful for system efficiency, but it is not identical to the converter’s own datasheet ratio.
Before comparing two products, draw the measurement boundary. Does the published figure include an on-board auxiliary converter, an internal fan if present, or power taken from a separate fan output? Is it measured before or after a downstream regulator in the host? Does the test use the board alone on a bench or an installed unit with cable and distribution loss? The answers need not all be the same across candidates, but a side-by-side percentage is meaningful only when the compared boundaries match.
AC line conditions matter. The same unit can have different losses at lower and higher permitted input voltage because rectification, switching, magnetics, and current levels change. A value stated at one line voltage should not be transplanted into an installation running another without a curve or measurement. Similarly, an AC-DC supply and a DC-DC board may both be described as open-frame, yet their input domains and test setups differ. The comparison begins with the actual source in the final equipment.
Find the load points the host actually inhabits
Efficiency is a curve, not a permanent property attached to the nameplate. Fixed housekeeping power and switching losses have different weight at light load than at full load; resistive losses generally grow as current rises. A single “up to” figure may mark the best point of that curve. It does not state the efficiency of a machine that idles for hours, starts a motor briefly, and then runs at a moderate process load.
Map representative states in DC output watts: standby or idle, ordinary production, periodic peak demand, and any sustained high-load condition. Note how long each state occurs. An industrial controller with a constant modest load may spend almost its entire life well below the converter’s rated output. A supply chosen for a rare surge might be less efficient in that dominant region than a smaller or differently designed unit. That observation is a reason to compare documented load curves, not a blanket recommendation to reduce headroom; startup, overload, thermal derating, and future load growth still have to be supported.
No-load input power belongs in a separate comparison. At zero delivered output, the ordinary efficiency ratio is not a useful percentage; there can still be standby consumption. For always-connected equipment, hours at no load or standby can contribute meaningful energy even when the converter is highly efficient at production load. The host’s controller, display, sensors, network interface, and cooling electronics may draw power in the same state, so distinguish converter standby consumption from the total equipment standby draw.
Translate efficiency into heat rather than an adjective
For a known DC output and efficiency at the same operating point, electrical input power is output power divided by efficiency. Converter loss is output power × (1/efficiency − 1). Bel’s technical discussion of power-supply heat presents this energy balance and relates the loss to the thermal design. The equation is a first-order heat budget, not a substitute for the exact model’s component-temperature limits or cooling instructions.
Consider a hypothetical open-frame AC-DC supply delivering 200 W to an embedded load. At 88% efficiency, it takes about 227.3 W at its AC input and loses 27.3 W. At 92% efficiency at the same input and output conditions, it takes about 217.4 W and loses 17.4 W. The difference is approximately 9.9 W of converter heat. The percentages and output here are illustrative, not specifications for any Powernexu or named manufacturer model. The difference cannot be claimed for a real candidate unless the two efficiency values actually apply at 200 W, the same line voltage, and comparable cooling conditions.
Ten watts can be important in a small sealed instrument and less decisive in a ventilated cabinet that already dissipates hundreds of watts. Its significance depends on the thermal resistance between the board’s hot components and the environment, the available airflow, nearby heat sources, and the permissible component temperatures. It also depends on where the load’s 200 W eventually goes. If that load dissipates most of its energy inside the same enclosure, the enclosure may need to reject roughly the converter loss plus the load’s own heat. Counting only the PSU loss would understate the cabinet requirement.
Do not turn a conversion-loss calculation into an automatic fan-size figure. Fan selection depends on flow path, backpressure, inlet temperature, allowable temperature rise, and the points on the board that must remain cool. The loss number tells the designer how much heat must leave the converter. It does not prove that nominal airflow from a fan reaches the transformer, switches, rectifiers, and capacitors inside the finished assembly.
Convection and forced air are different rating conditions
An open-frame board can be sold with one available-output figure under natural convection and a higher figure when specified forced air crosses it. That difference is not necessarily an efficiency improvement. The fan allows more heat to be removed while the board remains within its thermal limits. The converter may have a different efficiency at the higher electrical load, and the fan itself consumes power somewhere in the host. Treat maximum output, conversion efficiency, and cooling energy as three separate quantities.
The datasheet’s airflow condition can be expressed as air volume or velocity in a defined test arrangement. Neither is a promise that a host fan’s catalog rating appears at the PSU. Filter pressure loss, louvers, cable bundles, neighboring PCBs, and a baffle gap can divert the stream. Orientation affects natural convection too: rising warm air may escape from a vertically arranged board but accumulate beneath a horizontal shelf. A more efficient board can still overheat if the airflow misses its limiting component.
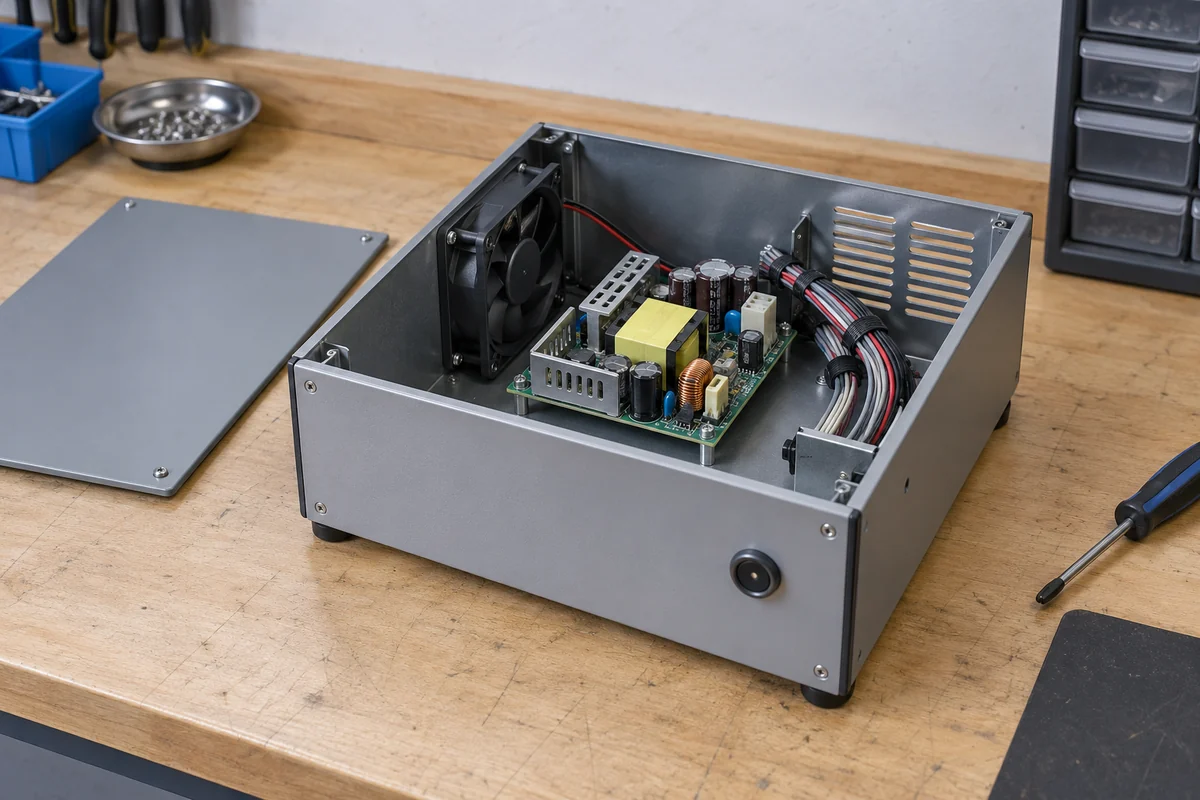
Where an enclosure uses forced air for other electronics, the incremental cooling cost of one PSU may be small. Where the PSU’s higher output rating requires adding a new fan, the host’s wall-plug energy and reliability picture change. A converter’s published efficiency usually describes conversion at its terminals, not the whole equipment including an external fan. The fan may also operate at different speeds across the load profile. For energy comparison, include the actual fan consumption only once in the system boundary; for a thermal comparison, account for whether the fan’s own electrical loss is released inside the enclosure.
Temperature can move the operating point while the equipment runs
A datasheet efficiency figure may be recorded at a controlled laboratory temperature. In the finished product, rising inlet air and nearby heat sources alter semiconductor and magnetic losses, while a controller may change fan speed or reduce load. The effect is model-specific; it is inaccurate to promise that every supply becomes a particular percentage less efficient for each degree of temperature rise. Use the supplier’s curves or direct measurement at relevant conditions.
Thermal derating must be read separately from efficiency. A converter may deliver its full rated DC output at one ambient and less at a hotter or poorly ventilated condition. The fact that it is electrically efficient does not erase that limit. If the output requirement exceeds the documented available power under the host’s actual inlet temperature and airflow, the design is unsuitable even if its peak efficiency is excellent. Conversely, a less efficient converter can still be thermally viable in an enclosure with a generous cooling path. Both outcomes are conditional on product data.
Measure the air the PSU sees, not only room temperature. An enclosure can recirculate exhaust into the board or place it downstream of a drive or processor. A sensor outside the cabinet can report comfortable ambient while a capacitor or transformer on the open board operates much hotter. Where the manufacturer identifies thermal test points, compare them under representative load and worst supported environment. Avoid attaching an improvised probe to hazardous or densely packed live circuitry; qualified personnel should use a safe, approved measurement method.
Whole-equipment energy is a different number
Conversion efficiency answers how much input electricity becomes usable DC at the PSU boundary. A facility meter observes much more: converter loss, load electronics, fans, displays, network equipment, and possibly other conversion stages. If a system has several AC-DC boards feeding different rails, summing their rated wattages does not estimate actual energy use. Each board runs at its own load point. For an honest equipment-level comparison, measure or calculate the power of the complete operating states, then weight them by time.
Return to the hypothetical 200 W load. If two converters genuinely differ by 9.9 W at that state and the equipment spends 4,000 hours a year there, the arithmetic difference is about 39.6 kWh a year for the converter alone. It is not an annual saving claim for any real product: the hours, input voltage, load, and actual curves have all been assumed. A fan added to support one arrangement, or a different idle-state efficiency over many more hours, can change the total comparison. Electricity price and cooling cost should not be attached until those system conditions are known.
In a host that exports most of its DC power to loads outside the enclosure, the PSU’s internal heat may be the central local cooling burden. In a compact controller whose processors and actuators release heat within the same box, the PSU’s loss is one piece of a larger thermal budget. These two systems can use identical converters and still need different airflow or heat-spreading designs. “Open-frame efficiency” is useful precisely when the electrical measurement boundary is connected to the physical place where losses accumulate.
The final comparison should therefore preserve two numbers side by side: the converter’s efficiency at documented load and input points, and the finished equipment’s measured energy and temperature under its real duty cycle. The first explains the source of conversion loss; the second shows whether the host actually handles that loss. Neither number can stand in for the other.