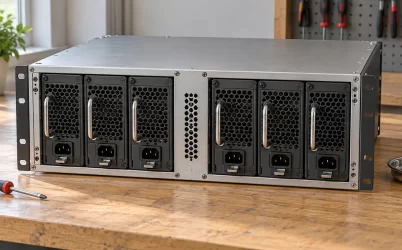
Bronze, Gold, Platinum, and Titanium do not assign four fixed efficiencies to server power supplies. They mark different minimum results under a specified 80 PLUS test category. In the program’s 230V/277V internal redundant category, the four published minimums at 50% of a PSU’s rated output are 85%, 92%, 94%, and 96%. That is a useful comparison only when all four numbers refer to the same category and load point. It is not a prediction of what four particular modules will draw in a server. Silver lies between Bronze and Gold, and Ruby now lies above Titanium, so these four commonly quoted names are not even the complete current tier sequence.
These four names are a selection from a larger classification system
The 80 PLUS program does not certify a generic thing called a “server PSU.” It records a particular power-supply model in an applicable input and application category. The program publishes separate criteria for 115V internal non-redundant units, 230V EU internal non-redundant units, redundant data-center supplies, and other input arrangements. Their numbers cannot be pooled into a single universal Bronze-to-Titanium chart. Even the same tier name can carry different numerical requirements in different columns of the program.
The comparison here uses the 80 PLUS ratings explainer’s 230V/277V internal redundant category. The category matters more than whether a seller calls the hardware a server module. First identify the category on the exact model’s certification record; then read the applicable load-point requirements. A desktop Bronze result at 115V cannot supply the Bronze row for a 230V redundant comparison. A 230V input printed on a product label does not, by itself, prove that the model has a certificate in this program category.
Nor are Bronze, Gold, Platinum, and Titanium successive rungs without omissions. Silver falls between Bronze and Gold in the program. Ruby is also listed above Titanium. The keyword’s four-way comparison is still useful: it spans a wide range of familiar labels. But presenting those four as the complete ladder would hide a real intermediate tier and a newer upper tier. A chart that removes Silver for readability should say so rather than imply a direct Bronze-to-Gold step in the program’s naming system.
Silver makes the omission concrete. In the same redundant-category explainer, its 50%-load floor is 89%: above Bronze’s 85% but below Gold’s 92%. At 20% and full load, the listed Silver floors are both 85%. Thus a Bronze-to-Gold jump in a four-label table spans an actual intermediate certification level at each of the ordinary comparison points. Ruby, meanwhile, has additional low-load criteria, so simply extending the four rows upward with another half-load percentage would also lose part of what distinguishes that newer tier. The omitted names change how the selected rows should be read, even though they are not the article’s main subject.
The 50% row shows an uneven progression
At one controlled point—half of each tested PSU’s rated DC output—the four selected tiers have clearly separated published floors. Bronze is 85%, Gold 92%, Platinum 94%, and Titanium 96% in the chosen redundant category. Those are lower bounds for certification, not four efficiencies that a real four-product comparison is guaranteed to produce. A module can measure above its tier’s floor. Its badge reflects the applicable set of tests, not a promise that it performs exactly at the threshold in every installed condition.
| Selected tier | 50% load minimum | Difference from the previous tier shown here | Important reading limit |
|---|---|---|---|
| Bronze | 85% | Starting point | Silver is omitted from this four-name comparison |
| Gold | 92% | Seven percentage points above Bronze | The gap crosses the unshown Silver tier |
| Platinum | 94% | Two percentage points above Gold | A floor is not an individual product result |
| Titanium | 96% | Two percentage points above Platinum | Ruby now exists above this tier |
The seven-point Bronze-to-Gold distance is not evidence of a sudden change in conversion physics between adjacent certification grades: Silver occupies part of that interval. Equally, the two-point steps from Gold to Platinum and Platinum to Titanium describe this one half-load row, not a uniform improvement at every output. A promotional chart that draws four evenly spaced labels on an axis would misstate both the program sequence and the numerical spacing.
There is also a denominator in every cell. “50% load” means half the individual module’s rated DC output under the certification procedure. It does not mean half the rack’s demand, half of a server’s CPU utilization, or half the nameplate sum of all installed PSUs. Without that denominator, a percentage taken from a valid table can still be applied to the wrong operating condition.
The 20% and 100% rows do not preserve the same spacing
Move to 20% of rated load in the same ratings explainer. Its published floors for the selected tiers are Bronze 82%, Gold 88%, Platinum 90%, and Titanium 94%. The gaps are six, two, and four points. At 100% rated load the listed floors are 82%, 88%, 91%, and 91%: six points, then three, then no difference between the Platinum and Titanium minimums. This is why a claim that “Titanium is always five points better than Platinum” has no basis in the table. Even the floor difference changes with the load point.
One source detail deserves explicit caution. CLEAResult’s general ratings explainer lists the redundant Bronze 20% and 100% cells as 82%, while its separate 230V redundant category listing currently shows 81% for those two cells. Both are official pages; this article does not silently combine them or pretend they agree. The preceding figures follow the linked explainer. Before quoting a Bronze threshold in a specification or contract, resolve that one-point difference against the current program record and the exact certificate rather than copying an isolated chart. The common 50% Bronze figure is 85% in both listings.
The 100% convergence of Platinum and Titanium certification floors has a narrower meaning than “the two tiers are equally efficient at full load.” It means their required minimums in this category coincide at that particular point. Two actual certified modules may report different measured full-load results. The tier is awarded over the applicable collection of requirements, so a model’s one impressive measured cell cannot stand in for its complete certification record.
A four-tier table is most reliable when every cell carries its test category, individual-module rated-load denominator, and the distinction between a minimum and a measured result. Remove any one of those qualifiers and the figures begin to look like universal product specifications. They are not.
An empty 10% comparison is not a low-load verdict
Titanium adds a named 10%-load efficiency requirement in the redundant category: 90% in the program’s published listing. The ratings explainer also notes that the 230V criteria below Titanium at that point are suggested. That asymmetry makes a neat four-row, four-column comparison tempting but misleading. An empty mandatory-floor cell for Bronze, Gold, or Platinum is not a claim that such a module has zero efficiency, cannot run at 10% load, or necessarily performs badly there.
A Platinum product may have published or certified measurements at a light load even when the tier’s qualification rule treats that point differently. The question “which model performs better at 10%?” requires results from the particular models at a comparable input, not a comparison between a Titanium minimum and a blank Platinum floor. Certification criteria answer which bar a model had to clear. A measured report can answer what that model actually did during a defined test. These are related but different forms of evidence.
The same distinction applies between listed 20%, 50%, and 100% points. The program’s row headings do not create a verified continuous curve for every unit. A buyer should not interpolate a Bronze-to-Titanium advantage at 37% load from a drawing unless product data supports that estimate. Where the precise intermediate result matters, the individual test report or manufacturer curve is more relevant than the badge alone.
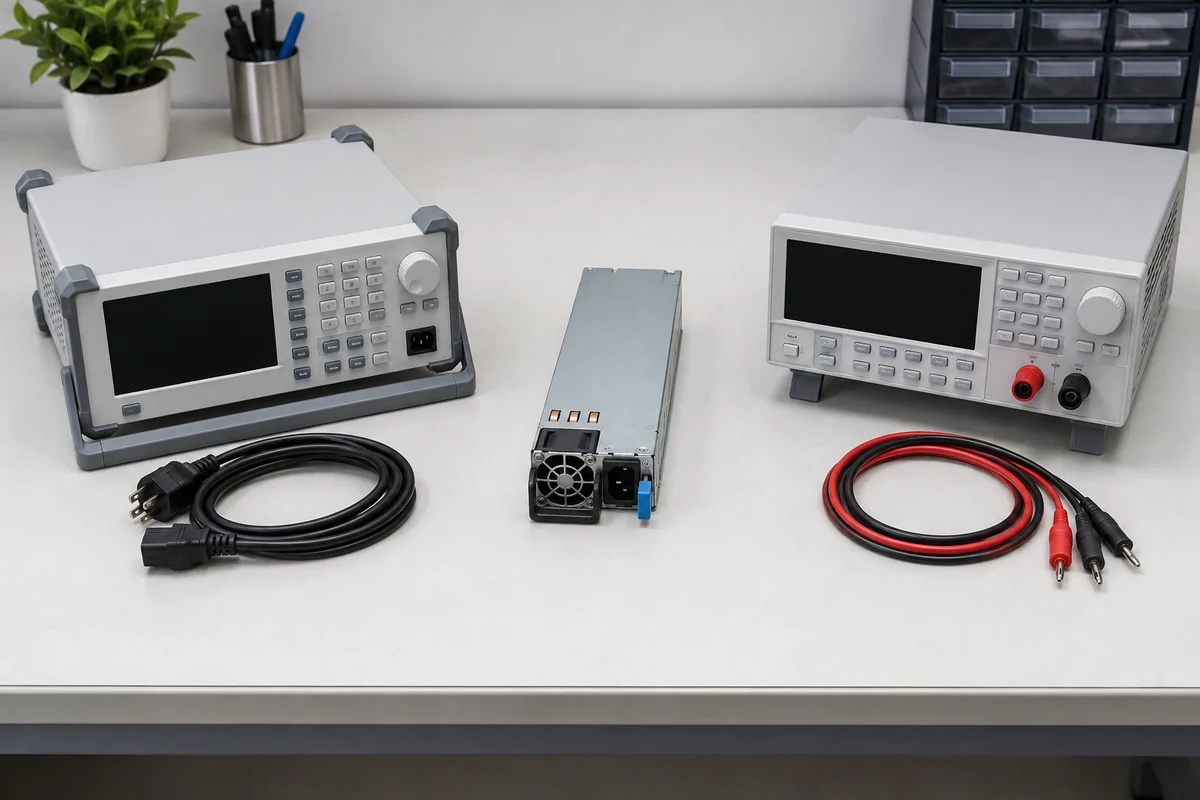
The measurement hardware illustrates why category and point are integral to a result: real AC input power and delivered DC output power must be determined under a specified loading procedure. It does not imply that the pictured generic PSU earned any tier, nor does an instrument arrangement reveal a certified percentage without actual readings. A photograph of a test bench is not a substitute for a model-specific report.
Follow the certificate to the particular supply, not the chassis
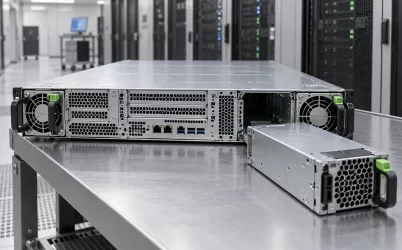
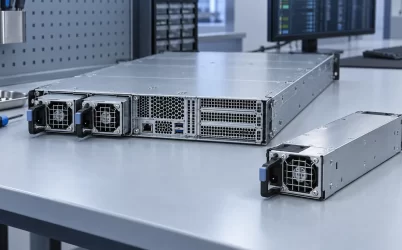
A certification attaches to an identifiable PSU model and test arrangement. A rack server may hold two modules, but it does not acquire a separate “Titanium server” certificate merely by accepting two Titanium-labeled supplies. Nor does the certification establish how the server shares current, whether the modules are operating or in standby, or whether one can carry the full system after the other is removed. Those are platform behaviors. The certificate describes conversion performance of the tested supply under its stated conditions.
Consider two externally similar removable modules in one host. One could be a certified model in the chosen redundant category while the other might have a different input configuration, a different tested model identity, or no matching report at all. Treating their shared chassis as evidence that both belong to the same table would be an identity error. The rear-panel view helps locate the two physical PSUs, but it cannot authenticate their test category or measured results.
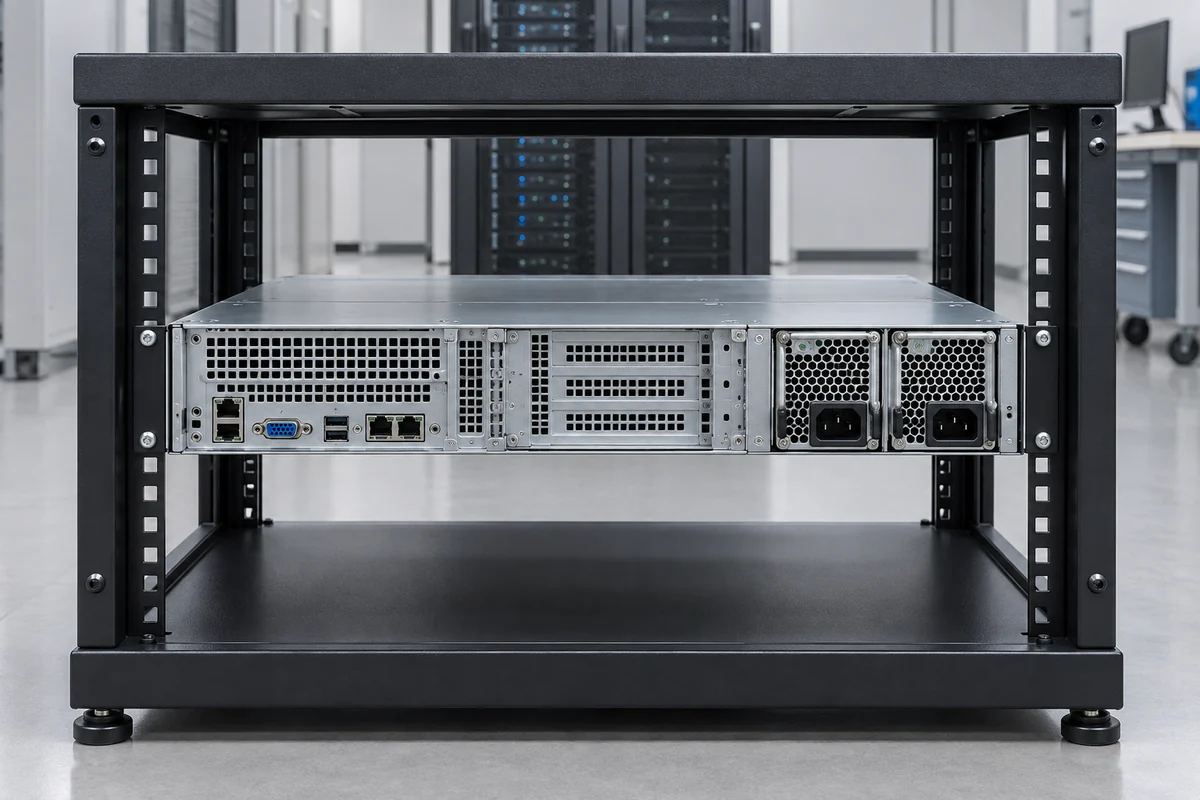
A certificate also cannot tell whether a module fits the host. Input connector, output architecture, backplane contact geometry, management behavior, depth, airflow direction, and approved population rules remain separate product-and-platform facts. This is not a reason to disregard efficiency grades. It is a reason to avoid asking a conversion-efficiency label to stand in for a compatibility document or a redundancy test.
Power factor is another field sometimes printed near efficiency figures. It relates real AC power to apparent AC power; conversion efficiency relates real input power to DC output power. The program can specify both, but a power-factor threshold must not be substituted for an efficiency cell. For a server buyer comparing rows, the model’s certified identity, category, input conditions, and rated-load point come before any broad claim that one label alone describes the entire supply.
What the four-tier chart can legitimately communicate
Within one named 230V/277V internal redundant category, the four familiar labels establish different minimum requirements, and the pattern varies by test point. The 50% row provides the clearest four-way staircase: 85%, 92%, 94%, and 96%. The 20% row has a larger Platinum-to-Titanium step, subject to the Bronze-source discrepancy noted above. The 100% row puts Platinum and Titanium at the same stated floor. Titanium adds a more explicit low-load hurdle. Silver and Ruby remind the reader that the four names are a selected comparison, not the full program ladder.
That is enough for the chart to be useful without making it do more than it can. It can state the relevant certification bar and prevent an apples-to-oranges comparison across input classes. It cannot rank the actual energy use, heat output, reliability, or host support of unspecified products. Those claims require the identified modules and the evidence appropriate to each claim. A sound explanation of Bronze through Titanium therefore ends with the category and the measured product record—not with a universal “best” PSU inferred from four badges.