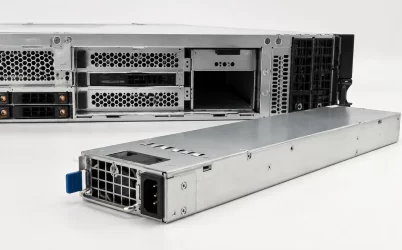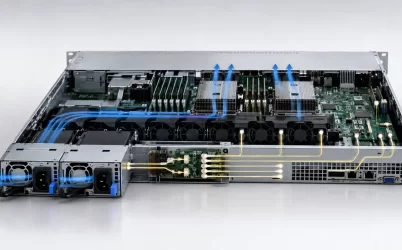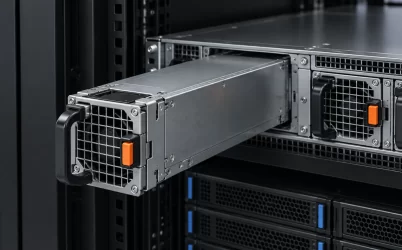
80 PLUS Titanium server PSU efficiency is most useful when it is translated into watts of loss at the loads a server actually experiences. The certification tier indicates strong conversion performance at defined test points, but a rack does not operate at a single percentage of nameplate power. Workload changes, redundant modules share and transfer load, inlet temperature moves, and fans consume energy of their own. The practical question is not simply whether Titanium is “better.” It is how much input power and heat a specific certified PSU avoids in the target system.
That answer can be calculated without turning the article into a certification-record tutorial. Start with DC output demand, use efficiency at the relevant operating point to estimate AC input, and compare the resulting loss. Then account for the way the server is populated and powered. This connects the efficiency tier to facility energy, rack heat, and power capacity while preserving the limits of what certification proves.
Efficiency is a ratio, while loss is a number of watts
Power-supply efficiency is DC output divided by AC input. If a server receives 900W of DC power and the PSU operates at 96% efficiency, the approximate AC input is 900 divided by 0.96, or 937.5W. The difference—about 37.5W—is conversion loss. At 93% efficiency, the same output would require about 968W and produce roughly 68W of loss. These are illustrative calculations, not claims for a particular model.
The ratio is helpful for comparing conversion quality. The loss in watts is more useful for infrastructure planning because it becomes heat and consumes upstream electrical capacity. Across 500 servers, a 30W difference at a representative load equals 15kW while that condition persists. The facility also has to remove the corresponding heat, so the operational effect is larger than the PSU input difference alone.
Do not multiply a nameplate rating by a fixed loss percentage unless the server actually operates at that output and the relevant efficiency is known. A 2000W Titanium module supporting a 500W load does not continuously lose the difference between 2000W and 500W. Nameplate capacity is an upper boundary; conversion loss follows delivered power and the efficiency curve.
Titanium data are measured at defined load points
The 80 PLUS program evaluates products under specified categories, voltages, and loading conditions. Titanium adds a light-load point in applicable program tables and sets demanding thresholds, but exact requirements are not universal across every product class. A redundant data-center PSU and a desktop supply should not be treated as identical tests merely because both use the Titanium name.
Use the official 80 PLUS program details to understand the applicable category, then confirm the exact model in the certified-product data. A shortened distributor title or a badge in a marketplace image is not enough to identify the tested unit. Model suffixes can indicate different inputs, airflow, firmware, or revisions.
Certification points are anchors on a curve. Efficiency between them is not necessarily linear, and installed operation can differ because of input voltage, temperature, airflow, fan speed, and component tolerance. The correct engineering use is to treat certified data as trustworthy standardized evidence, then use product-specific performance information or measurements when a precise rack estimate is required.
A test bench reveals the quantity that the rack consumes
For a direct measurement, the PSU is supplied through a suitable power analyzer and loaded with equipment capable of controlling the DC output. Input power, output power, voltage, current, and temperature are observed after conditions stabilize. Measurement uncertainty, cable loss, auxiliary rails, and fan consumption need consistent treatment if two products are being compared.
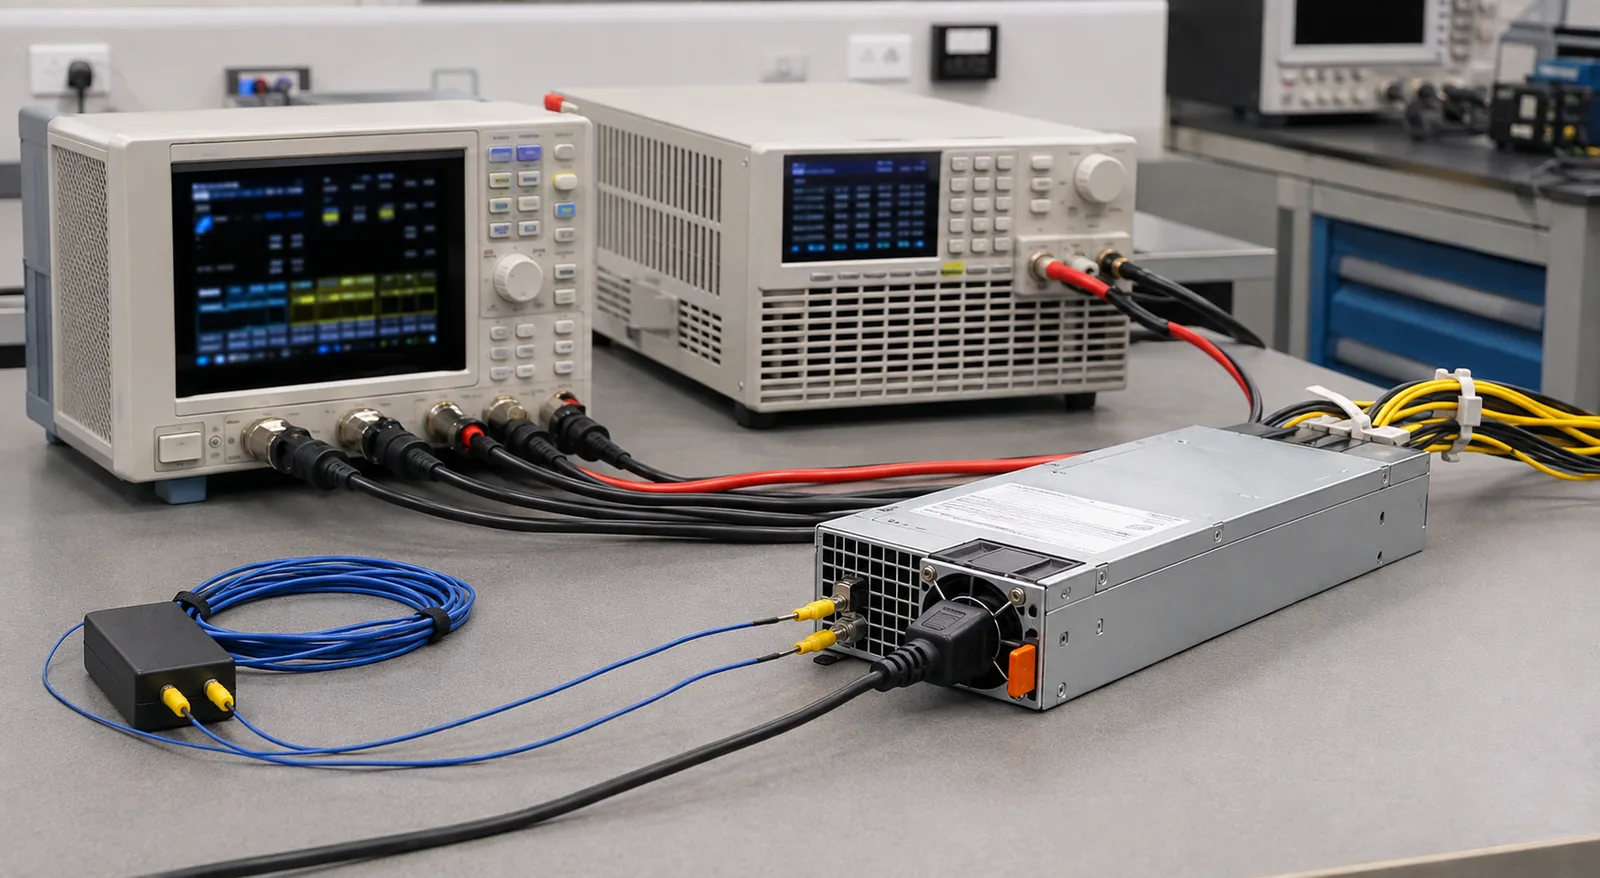
The image shows why efficiency is not inferred from the label alone. The analyzer must see the AC input while the load receives the DC output, and thermal probes help explain changes that occur as the module warms. This is particularly valuable when the server’s expected operating point falls between certification points or when fan power rises sharply at high load.
A production server can also provide useful input and output telemetry, but its accuracy and boundaries must be understood. Facility meters may include rack distribution losses. BMC readings may report PSU input, output, or an estimate with limited update rate. Data from different boundaries should not be subtracted as if they were synchronized laboratory measurements.
Redundant pairs spend much of their time at a lower module load
Consider a server that requires 1000W of DC power. One 2000W PSU would be at about 50% load. Two 2000W modules sharing evenly would each be near 25%. If one module failed, the survivor would return toward 50%. The server workload has not changed, but the modules have moved to different places on their efficiency curves.
This matters because redundant operation can trade a small amount of conversion efficiency for availability. Running two converters, two controllers, and two fans may consume more than running one module at a higher load. Some platforms support power-supply management modes that concentrate load on one module during safe conditions, but such behavior must come from the server design and availability policy. It should not be enabled casually when independent feed protection or immediate load transfer is required.
The energy model should therefore include ordinary shared operation, any supported efficiency mode, and the single-module state. The failure state may be infrequent, so it contributes little to annual energy, yet it remains critical for capacity and temperature. Efficiency and redundancy answer different operational needs and should not be collapsed into one score.
Workload distribution matters more than one peak
A server rarely sits at its maximum continuous load for every hour. CPU utilization, accelerator duty cycle, storage activity, fan speed, and idle intervals create a distribution. For energy estimation, calculate loss across representative load bands and weight each band by time. Even a simple model with idle, typical, and intensive states is better than applying full-load efficiency to the entire year.
Imagine a server that spends 50% of its time at 400W DC, 35% at 800W, and 15% at 1200W. The annual PSU loss depends on efficiency at all three points. A candidate with a small advantage at 1200W but weaker light-load performance may consume more overall than another candidate if the machine spends most of its life at 400W. Titanium’s light-load requirement can be valuable here, but the actual module and system still need to be matched to the profile.
Virtualization, workload scheduling, and power capping can reshape that distribution. Consolidating work onto fewer active servers may raise their individual load and allow others to enter lower-power states. The facility-level saving may exceed the difference between PSU tiers, while efficient conversion preserves additional benefit at the new operating points.
Heat and fan response can change the installed result
Every watt not delivered as DC output appears mainly as heat in the PSU. A lower-loss converter reduces heat at the source, but cooling behavior can amplify or partially offset the saving. Dense server modules use small, high-speed fans. As inlet temperature or pressure resistance rises, fan power and acoustic output can increase. A few watts saved in conversion can be accompanied by a larger or smaller change in fan demand depending on chassis control.
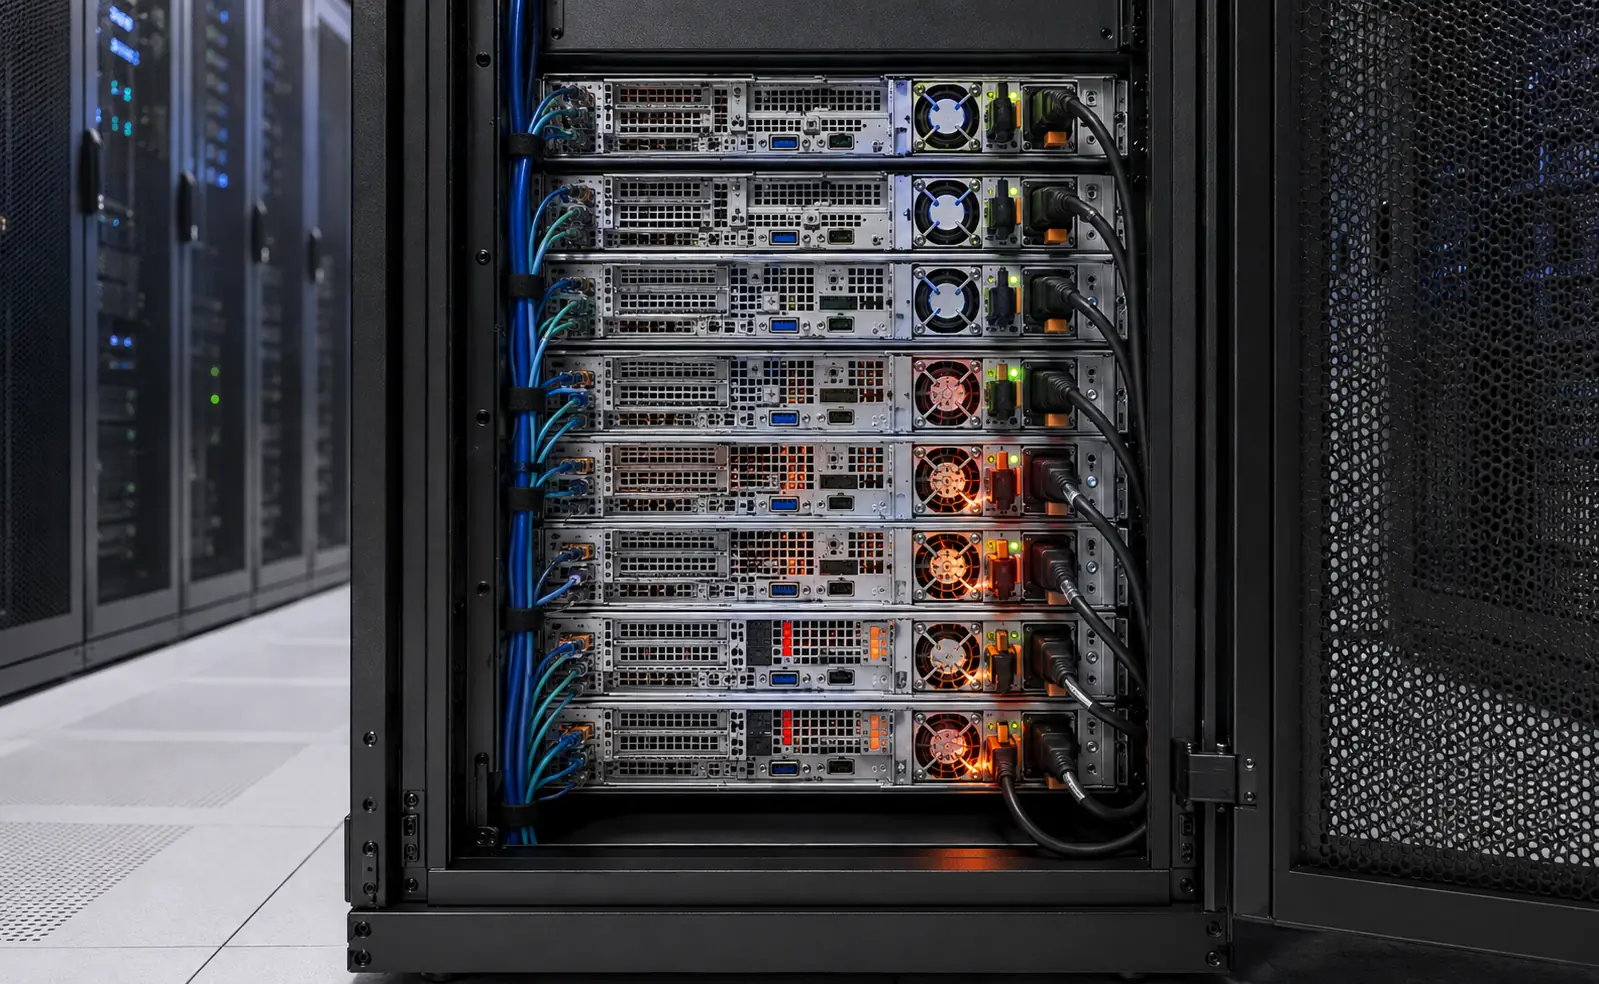
The rear-rack view below represents mixed server loads rather than a certification table. It supplements the calculation by showing that modules in the same rack can occupy different thermal states. Cable placement, blanking, recirculation, and local inlet conditions influence what each PSU experiences.
For a high-density row, PSU loss belongs in the rack heat estimate, but it should not be double-counted. Metered AC power already includes conversion loss. If IT DC demand is modeled separately, divide by efficiency to obtain PSU input; do not add the full AC figure again as a separate cooling load.
The economic value depends on operating hours and energy price
Once the loss difference is known, annual energy follows directly. A 20W reduction sustained continuously uses about 175kWh less per year because 0.020kW multiplied by 8760 hours equals 175.2kWh. Multiply by the applicable electricity price for a direct energy estimate. A more complete facility view can include cooling and distribution effects, but those should be based on site data rather than a universal multiplier.
Purchase price is only one side of the comparison. High-efficiency modules may reduce energy and heat, while a host-approved platform can also simplify spares and avoid compatibility risk. Conversely, replacing functional servers solely to obtain a higher PSU tier may not recover its embodied cost or capital expense. The appropriate comparison uses the actual refresh cycle and projected workload.
At small scale or low utilization, the monetary difference between two already efficient supplies may be modest. At fleet scale, continuous operation turns small watt differences into material capacity. In a power-constrained data center, recovered input capacity can sometimes be more valuable than the electricity saving because it permits additional compute within the same electrical envelope.
Titanium is valuable evidence, not the complete server result
An 80 PLUS Titanium rating gives a credible standardized view of conversion performance for the certified model and category. It does not specify host compatibility, redundant failure behavior, airflow direction, telemetry accuracy, or the server’s load profile. Those factors determine where the module operates and whether its low loss survives installation.
The most useful conclusion is a rack-specific loss estimate: identify the exact certified PSU, map representative server loads to module loads, calculate AC input and watts of loss, and include the thermal and redundancy states that genuinely occur. That approach turns an efficiency tier into an operational number without asking the badge to prove more than it was designed to prove.