How much electricity does an AI server use? There is no reliable single wattage for the category. At one server’s AC inputs, power changes with the installed accelerator platform, the job, utilization, cooling demand, power limits, and the periods between jobs. The usable answer is a measured input-power range for a named configuration and workload, followed by energy in kilowatt-hours over the period that matters. A GPU’s advertised maximum power, a PSU nameplate, and a rack-feed reading each describe a different boundary; none is automatically the server’s actual consumption.
An idle AI server is not an unplugged server
An AI node with no active training job still runs a motherboard, memory, storage, networking, management electronics, and fans. Accelerators may be in a low-power state without being electrically off. Firmware policies, background services, and the cooling response to inlet temperature change the resting draw. The word idle itself can mean different things: booted but waiting, a model resident in GPU memory, an inference service accepting no requests, or a node drained and prepared for maintenance. Those states should not be merged into a single baseline.
This matters for an installation whose work arrives in bursts. A server that spends many hours ready for low-latency inference may consume substantial energy outside the short intervals when GPUs are heavily occupied. Turning it off between requests could improve energy use but may violate availability or response-time requirements. The electrical answer and the service answer are linked: a measurement campaign should state which idle policy was in force rather than assume that the minimum observed wattage is what production will achieve.
Training, inference, and data preparation draw different power
A long training run can hold accelerators active for sustained intervals, though utilization still moves with batch size, synchronization, memory stalls, checkpoints, and data delivery. Inference has another shape: the same model may alternate between waiting, handling bursts, and producing tokens under different batch sizes. Data preparation can keep CPUs, memory, storage, and network interfaces busy while GPUs wait. Two jobs with identical GPU counts therefore need not produce the same server AC power or the same energy per useful result.
Consider an inference service that must keep a model warm for fast responses. Low request volume may create a modest average GPU board-power reading, yet the host and cooling systems remain on. Another deployment may batch requests to use the accelerators intensively for shorter windows and place idle resources in a lower-power state afterward. The second could use less energy per request even if its peak AC input is higher. The comparison is only valid if latency, throughput, and service availability are comparable; otherwise lower consumption may simply reflect less work delivered.
Training deserves a similarly careful denominator. A lower power cap can reduce instantaneous watts, but a job may take longer. The right energy comparison is watt-hours over the complete run, including preprocessing, checkpointing, retries, and the server’s waiting time if that time is attributable to the job. A cap that lowers peak demand is useful for electrical capacity even when it does not minimize total energy. These are different operational objectives, and a single maximum-power number cannot settle both.
GPU telemetry is not a wall-power meter
Accelerator telemetry helps explain why the server draw moves. NVIDIA’s DCGM metric documentation, for example, distinguishes supported GPU board-power and energy fields and notes that availability depends on the device and deployment. Such counters are useful for comparing GPU states and associating work with accelerator activity. They do not include every joule drawn at the node’s AC input.
The difference includes CPU and memory consumption, network adapters, storage, fans, management components, and conversion loss in the server power supplies and downstream regulators. Some platforms expose a BMC “system power” sensor that appears closer to the total, but its measurement location, accuracy, sampling interval, and included devices are platform-specific. A software chart labeled “system watts” should not be treated as the AC inlet until its documented boundary is known.
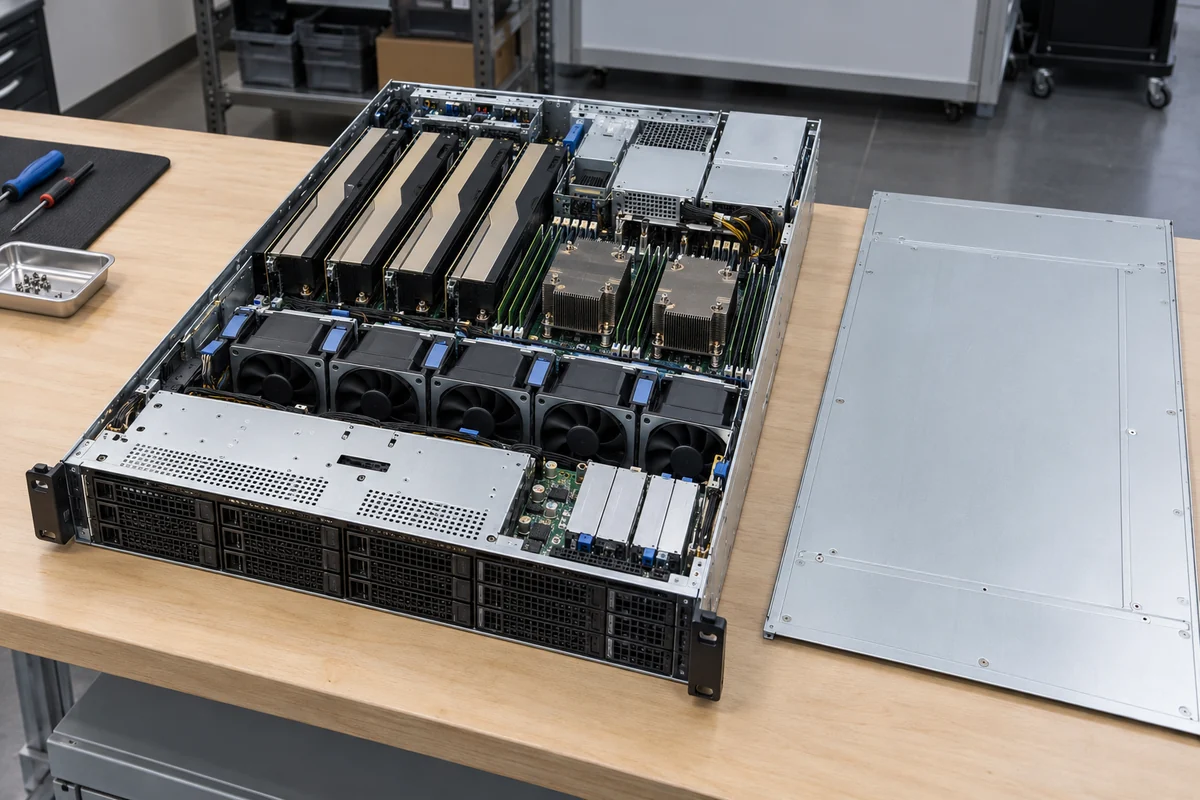
Nor does summing GPU power limits produce a consumption reading. A limit is a control ceiling; current board power depends on the work and control state. Summed GPU sensors can also hide asynchronous behavior. An eight-accelerator job may keep several devices busy while others wait at a synchronization barrier. Add the instantaneous samples at matched timestamps if the goal is to see accelerator contribution. Add the energy counters over the job interval if the goal is accelerator energy. Do not add each device’s highest observed sample and call the result the server’s peak: those peaks may have occurred at different times.
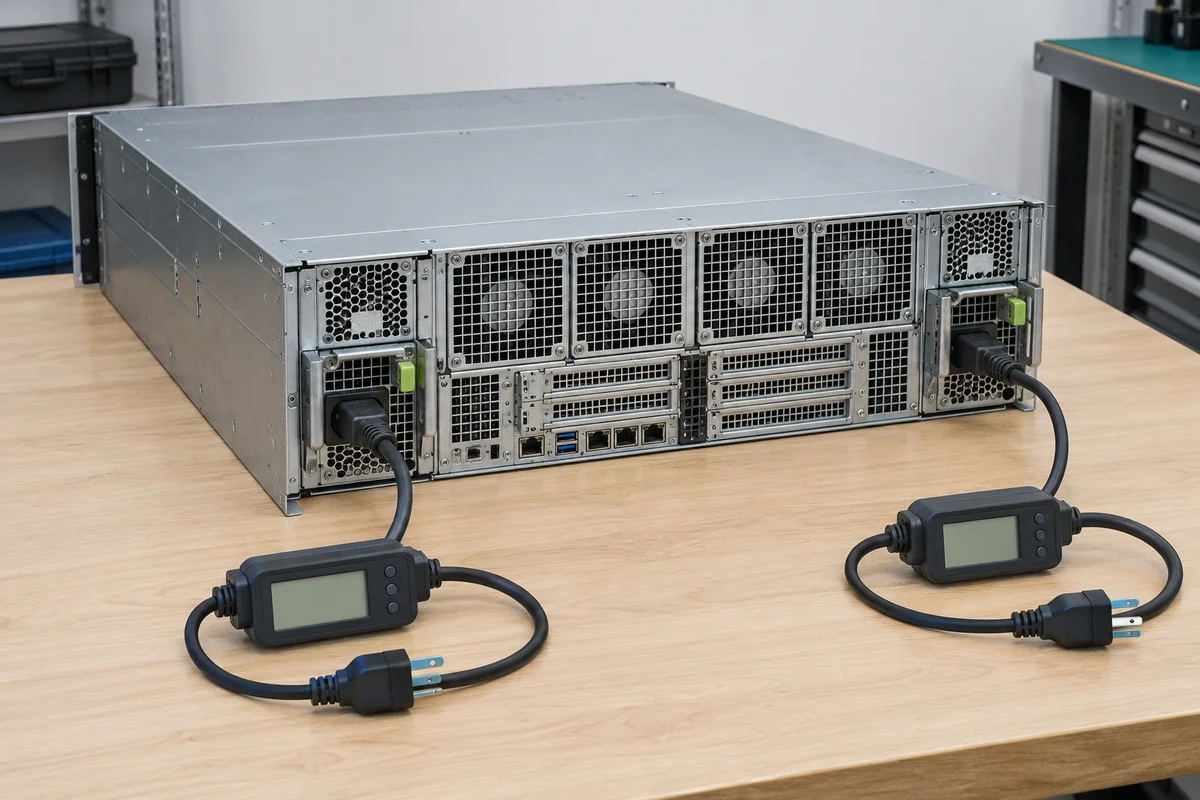
A useful monitoring display therefore retains both layers. Node AC input answers what the electrical distribution supplies and what the customer may be billed for at that boundary. GPU telemetry helps identify whether the power went toward useful accelerator work or a less productive state. Neither substitutes for the other. If the node uses two AC cords, their simultaneous real-power readings should be summed for one server; the two PSU nameplate ratings should not be added as a proxy for consumption.
Locate the measurement at the individual node
The cleanest external boundary is the server’s AC inlet or the metered outlets feeding only that server. With two cords on separate A and B feeds, capture both at the same time and add their real power. A rack PDU that also feeds neighboring servers cannot supply a node-specific number unless individual outlets are metered or other loads are separately accounted for. This is where single-server analysis stops; a rack-total calculation is a different problem with different aggregation rules.
Measurement resolution matters. A slow polling interval can describe a sustained training phase well but miss a brief accelerator or CPU excursion. A very fast interval may capture spikes that are irrelevant to monthly energy but important to upstream electrical limits. Choose the interval for the question: seconds or faster where supported for dynamic power behavior, and longer integrated energy intervals for consumption across a day or a job. Retain timestamps, because a power value without its corresponding workload state is difficult to interpret.
Input meters should report real power in watts or accumulated energy in kilowatt-hours for the quantity being used. Voltage and current alone do not automatically equal real AC watts because power factor matters. A server BMC, an intelligent PDU, and a laboratory power analyzer may report slightly different figures even when all are operating correctly: they can sit at different electrical boundaries and sample differently. First resolve the boundary, then investigate instrument error or calibration if the difference remains significant.
A production comparison also requires consistent scope. If one node’s meter includes an external network switch and another does not, their apparent energy efficiency is not comparable. If an external power shelf feeds several nodes over DC, a per-node allocation needs an explicit method; a shared shelf’s full AC reading should not be assigned to each server. The exact architecture determines where direct measurement is possible and where allocation begins.
Turn a workload run into a defensible energy figure
Instantaneous power describes the electrical rate at a moment. Energy is the area under that power-versus-time curve. If a server holds 2 kW for one hour, it uses 2 kWh over that hour at the measurement boundary. Real jobs move between states, so the practical method is to sum energy-meter increments over the relevant window or integrate synchronized power samples. The window must have a meaningful start and stop: a job’s scheduler allocation, the inference service’s operating day, or the interval during which the node is reserved for an experiment.
For a deliberately hypothetical example, suppose a single metered node draws an average 0.8 kW while ready for three hours, then 2.4 kW during five hours of active work. At that AC boundary, the first interval uses 2.4 kWh and the second uses 12 kWh, for 14.4 kWh across eight hours. The example is not a rating, benchmark, or forecast for any real AI server. Its purpose is to show why the duration of the ready state matters alongside the active draw. Changing the time allocation changes the energy result even if the two average wattages remain identical.
If the node performs several jobs, attributing shared ready time is a policy choice rather than a meter fact. For capacity planning, count all server energy because the electrical system supplied it. For energy per training run, state whether pre-job waiting and post-job cooldown were included. For inference energy per request, state whether the always-on baseline is spread across all requests or treated separately. A comparison that omits this boundary can make one platform look better simply by assigning its idle overhead elsewhere.
Similarly, a useful output metric should match the workload. Kilowatt-hours per completed training run, per fixed number of inferences at a defined latency target, or per processed dataset can reveal something that raw average watts cannot. But those denominators require comparable model quality, hardware configuration, software stack, service level, and result. A lower electrical number produced by a slower or less capable service is not automatically an efficiency improvement.
Power limits may reduce the peak without reducing the bill
AI platforms can constrain accelerator or system power through supported hardware and management controls. A lower limit can make a node fit within a branch-circuit or redundancy boundary and may lower heat at a particular instant. Its effect on total energy depends on performance response. If power falls moderately while runtime grows substantially, a full job can consume as much or more energy; if efficiency improves enough, energy can fall. There is no universal direction without measuring both work completed and input energy.
The workload matters here. A compute-bound training stage may react differently from one limited by memory, network synchronization, or data loading. Inference latency requirements can also set a minimum operating state that prevents aggressive down-clocking between requests. Fan and regulator losses respond to the changed load, but they do not necessarily move in the same proportion as GPU board power. A GPU-only energy chart can therefore overstate the node-level gain from a power-cap setting.
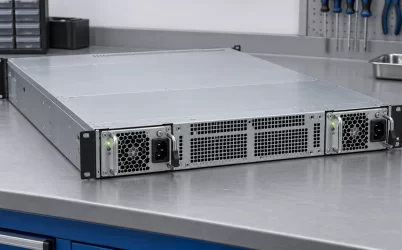
Power capping should also be distinguished from supply sizing. A node may be configured to operate within a cap during normal service but need a policy for boot, recovery, firmware activity, or a lost AC feed. These are capacity and resilience questions; they do not change the definition of measured consumption. A server with two redundant power modules still draws the power required by its current work plus conversion overhead, not twice the load because two module ratings appear on the rear panel.
One number needs a named condition beside it
A useful AI-server consumption statement can be concise without pretending to be universal: identify the server model or configuration, the AC measurement point, whether one or both feeds are included, the workload or idle state, the time interval, and whether the figure is average watts, peak watts, or energy. These details are not administrative decoration. They determine whether the number describes an outlet, a GPU board, a whole node, or an allocated share of a larger system.
For power budgeting, retain a high sustained draw and any relevant short excursions. For energy and cost, retain integrated kilowatt-hours over representative work and waiting periods. For optimization, pair the same energy record with a comparable unit of completed work. Those three questions can be answered by the same server, but not by the same unqualified wattage claim.