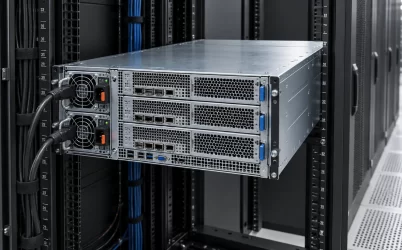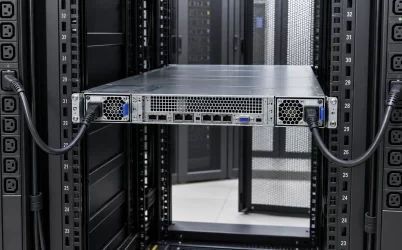
A server power supply efficiency test report answers a narrower question than a product’s efficiency badge: at specified input conditions and output loads, how much electrical power entered the tested PSU, how much left as useful DC output, and what was lost inside the conversion process? A credible report identifies the exact model and tested configuration, shows measured input and output power at stated load points, and makes its test conditions visible. It does not by itself predict the electricity bill of a complete server rack, establish compatibility with a chassis, or prove that every production unit will perform identically. Those distinctions are essential when using a report to compare power supplies for a real installation.
The model identity comes before the percentage
The first useful field is not the largest efficiency number on the page. It is the identity of the unit that was tested. A report may list a manufacturer, brand, model, revision, rated output, and sometimes a configuration or part-number suffix. These details matter because a supplier’s commercial listing might group several variants under one family name. An alternative fan, output voltage, input range, cable assembly, or hardware revision may alter losses or fall outside the reported configuration. A claim about a “series” is therefore not automatically a measurement of the exact unit being quoted.
Compare the tested designation with the label and controlled specification of the intended purchase. If the names differ, determine whether the report explicitly covers the quoted variant or whether another test record is required. Do not infer equivalence from similar appearance or the same nominal wattage. For a replaceable server cartridge, the server manufacturer’s approved part list remains a separate question: the efficiency report can describe conversion performance while the host documentation determines whether the module is supported in its cage and management system.
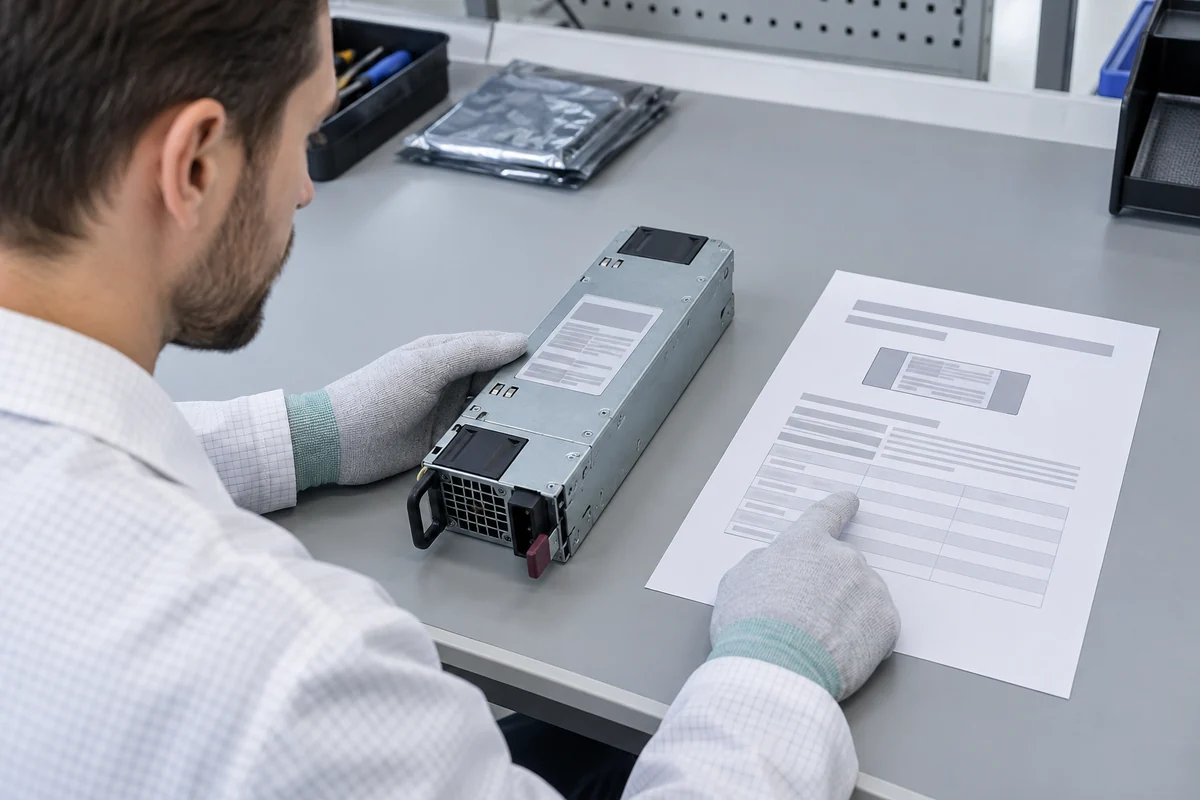
The official 80 PLUS certified-PSU database permits searches by model name. That makes it useful for checking whether a certification claim resolves to a real listed model, but the public listing is not a substitute for reading the attached report and matching its identity to the proposed unit. A badge on a quotation is weaker evidence than a report tied to the exact designation.
Reconstruct the measured conversion loss
Efficiency is the ratio of DC output power to AC input power at a stated operating point: efficiency = DC output ÷ AC input. If a report shows 1,000 W delivered to its DC load and 1,080 W drawn from the AC source, the calculated efficiency is about 92.6%; the difference, about 80 W, is conversion loss in the PSU under that test condition. These are hypothetical values for explaining the arithmetic, not a claim about a Powernexu product or a certification threshold. A report should permit this calculation from its measured fields, subject to its published rounding rules.
Power factor is a different measurement. A high power factor can improve how an AC source is used, but it is not the percentage of input energy converted into DC output. Likewise, apparent power in volt-amperes is not interchangeable with real input power in watts. Read the field names and units before dividing numbers. If the report includes multiple output rails, the DC output used in the efficiency calculation is the total measured output under the reported load condition, not simply the headline wattage printed on the case.
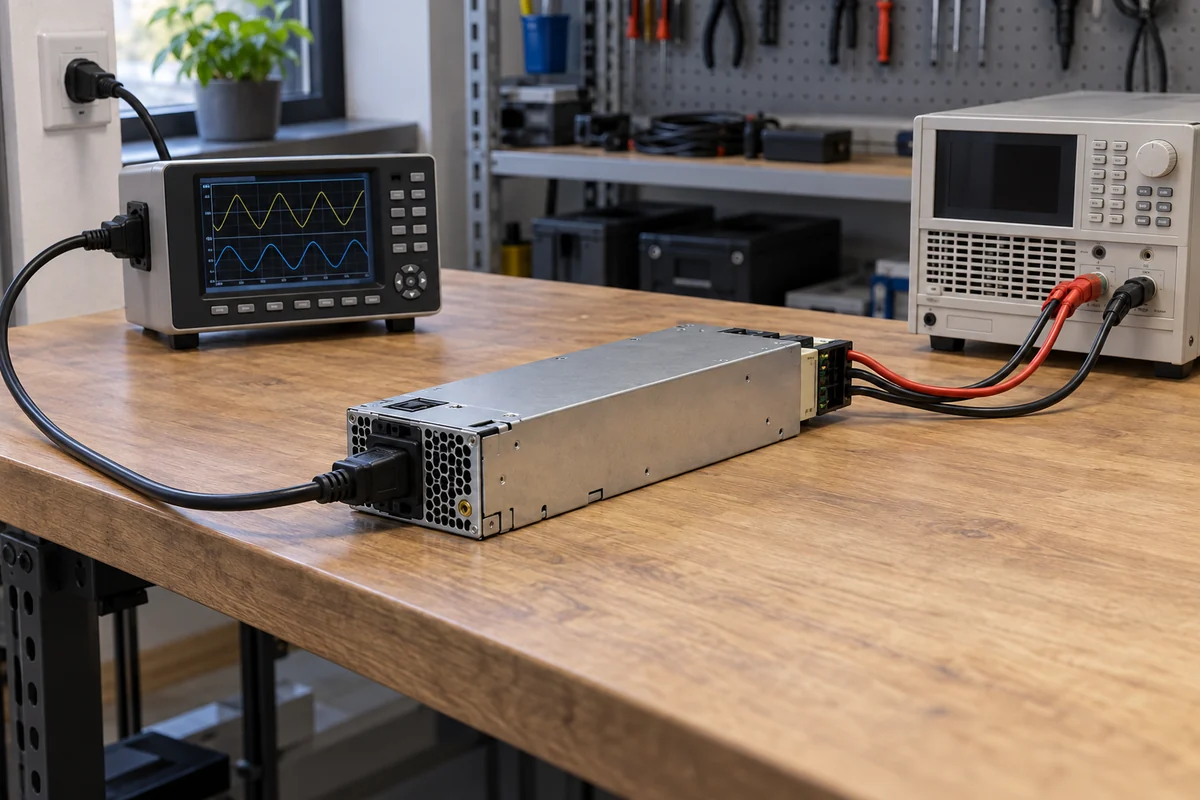
The loss figure is useful because it has a direct thermal meaning: almost all electrical power lost inside the operating PSU eventually becomes heat. Yet an 80 W laboratory loss is not an 80 W heat prediction for every server deployment. Actual load, inlet temperature, input voltage, fan behavior, and neighboring airflow may differ. The measured point can support a comparison of candidates under like conditions; it cannot replace a thermal assessment of the installed assembly.
Read the load points as a curve, not a trophy number
Efficiency changes with load. Fixed control and auxiliary losses occupy a larger share of input power at light load, while conduction and switching losses can rise as current increases. Consequently, a single “peak efficiency” figure can conceal the operating region that matters to the buyer. A test report normally presents several load points as fractions of rated output. Read the efficiency at each point and compare it with the expected distribution of the server’s actual DC demand.
Imagine two hypothetical 1,600 W supplies. One is marginally more efficient near half load; the other performs better around a quarter load. If a fleet of servers normally draws about 400 W DC per active PSU, the latter curve may be more relevant than the former’s peak number. This is an illustration of operating-point matching, not a recommendation of either imagined product. If the server uses two supplies in a supported current-sharing mode, each may carry only part of the normal load; if one fails, the survivor may move to a very different point on its curve. The report does not establish how a particular platform shares current, so use its host documentation or measurements rather than dividing load by two automatically.
A report’s stated percentages may also be tied to rated output, not to the wattage the server usually consumes. For a 1,600 W unit, a 50% test point represents an 800 W DC test load on that unit. It does not mean the server runs at 50% CPU utilization, and it does not describe the full rack’s utilization. Keeping those denominators separate prevents a common spreadsheet error: applying the efficiency at one laboratory point to every hour of site operation.
For an energy estimate, segment the operating hours into defensible DC load bands, use efficiency data near each band when available, and calculate AC input as DC output divided by efficiency. Sum the energy over time. Even then, treat the result as a PSU-conversion estimate. Cooling, UPS losses, distribution, fans, and other facility loads sit outside that boundary unless they are deliberately included elsewhere in the model.
Input conditions can change the comparison
The report must state the source conditions under which the unit was tested. An efficiency result measured on a 230 V AC supply should not be described as a measured result at 115 V AC. Server deployments may operate at different mains voltages and frequencies, and some high-output modules have different available power at lower input voltage. The efficiency numbers and the output rating should therefore be read together with the report’s input condition and the product’s own operating specification.
When comparing two reports, place their input voltages, frequency, load definitions, and test methods side by side. A percentage-point difference is not a clean product comparison if one report uses a different input condition or different measurement boundary. The same warning applies to AC-input PSUs versus DC-input modules: the source, measured boundary, and applicable test procedure must be clear before the numbers are compared. Do not normalize unfamiliar conditions with an invented correction factor.
Temperature is another boundary. A controlled laboratory ambient simplifies repeatable measurements, but a rack PSU may receive air that has already warmed inside a chassis. Fan power can also change as temperatures rise. Ask whether the report includes the module fan and any required auxiliary hardware in its measured input/output boundary. Where the report does not describe installed thermal behavior, use it as evidence for conversion efficiency under the published condition, not as proof of field efficiency at a hotter inlet.
What the report excludes from a server-level claim
The PSU converts power, but the server uses an entire distribution chain. After the converter, current may pass through blind-mate contacts, a power distribution board, busbars, cables, and point-of-load regulators before reaching processors or drives. Their losses may not appear in the PSU efficiency test. Equally, a redundant server with two AC cords may impose different operating states from a single test unit on a bench. A certified PSU can therefore be an efficient component of a server whose overall energy performance is determined by much more than the PSU certificate.

A test report also says little about startup, load-step response, hold-up behavior, fault isolation, acoustic output, serviceability, or compatibility with a BMC. Those qualities may be decisive for deployment, but they require different evidence. Avoid turning a report that measures conversion performance into a universal quality score. A highly efficient module with the wrong connector or unsupported firmware is not a suitable replacement; an approved replacement does not inherit a claimed efficiency class merely because another family member has one.
The boundary matters especially when comparing a single-unit report with a redundant assembly quotation. If a cage contains two modules and a PDB, identify whether the quoted efficiency applies to each module alone or to the assembled system at a defined load-sharing point. Without that statement, the figures answer different questions. The assembly may introduce distribution loss, standby consumption, or altered fan operation that the module-only report was not designed to capture.
Different questions need different report fields
A purchaser checking a supplier’s efficiency-class claim needs model identity, certification listing, report date or revision where supplied, and the load-point results that correspond to the applicable program category. An engineer estimating server heat needs measured conversion loss near the relevant load and input condition, plus a separate understanding of chassis airflow. A facilities planner estimating energy needs a load profile over time, not simply the best point on the curve. These are three legitimate uses of the same document, but each draws on different evidence.
Consider a hypothetical replacement project in which a server uses a 1+1 PSU pair. The existing modules are rated 1,200 W each, and the expected active system demand is around 550 W DC. A candidate report gives efficiency at several test points, but it does not reveal whether the server will share at roughly 275 W per module, keep one module lightly loaded, or change behavior in a platform-specific power-saving mode. The buyer can compare the candidate’s published points, but cannot produce a defensible annual-savings number until the host’s operating mode and measured workload are known. After a module failure, the survivor must also support the actual load under the site’s input and thermal conditions; the efficiency report alone cannot establish that protected capacity.
If another candidate’s report appears better by a small margin, check the size of the implied loss difference before treating it as decisive. At a 600 W DC operating point, an efficiency of 92% implies about 652 W AC input, while 93% implies about 645 W. The approximate seven-watt difference per active unit may matter across a large fleet, but whether it justifies a purchase premium depends on operating hours, electricity price, reliability and service constraints, and the validity of the comparison. The arithmetic is more useful than repeating the certification label, provided both efficiencies describe the same kind of load and input condition.
When an efficiency report is insufficient
A missing or mismatched report does not prove a supply is inefficient; it means the specific efficiency claim lacks the evidence needed for that comparison. If the buyer needs a certified level, obtain the exact applicable listing or report. If the buyer needs energy modeling, obtain measured points that represent the installed input and load range, or clearly label the result as an assumption. If the buyer needs an approved server spare, obtain host compatibility evidence separately. These requests cannot be collapsed into one document because they address different technical properties.
Likewise, a valid report should not be dismissed merely because it does not discuss the full server. Its job is to isolate and quantify PSU conversion performance under controlled conditions. The practical reading is straightforward: identify the tested unit, verify the input and loading conditions, recompute the output-to-input relationship, examine the load curve relevant to the host, and keep all downstream system claims outside the report’s measured boundary. Once those boundaries are explicit, the efficiency test report becomes useful evidence rather than a decorative percentage on a product listing.