A server fitted with a 600W power supply does not continuously consume 600W from the wall. The 600W figure is normally a rated DC output capability under the module’s documented conditions. Actual AC input depends on the server’s present DC load and the PSU’s efficiency at that load and input voltage. To estimate operating cost, measure AC energy over a representative workload; to judge whether the supply is adequate, evaluate peak and fault-state DC demand separately. Those are related but different questions.
A single “power consumption” number can hide an idle night, a storage rebuild, a busy application window, and a fan-speed increase. The useful result is a profile in watts and kilowatt-hours, with the measurement boundary stated. This article shows how to build that profile without mistaking a PSU label, BMC reading, or one brief meter snapshot for the server’s monthly energy use.
Draw the boundary: DC output, AC input, or rack energy
The server’s components receive DC power after conversion. A wattmeter at the supply input sees AC power delivered to the PSU, which includes conversion losses. A rack PDU reading may include the server, other devices on that outlet group, and meter uncertainty. A BMC sensor may report a platform-specific internal value. Before comparing numbers, record where each instrument measures and what the reading includes.
The basic relationship is AC input power equals DC output power divided by efficiency, provided efficiency is expressed as a fraction for the same operating point. If a hypothetical server requires 300W of DC output and a hypothetical PSU is 90% efficient at that point, AC input is about 333W. The difference, about 33W, is conversion loss that ultimately becomes heat. This is an arithmetic illustration, not a certified efficiency claim for any 600W model. A real calculation needs the exact model’s measured curve at the relevant input and load.
Do not reverse this equation without checking the measurement boundary. A 300W value from an AC PDU is not the same as a 300W DC load. Likewise, a “system power” value in one BMC cannot be assumed to represent the same domains as a value from another platform. If no reliable DC instrument is available, a representative AC energy measurement can still answer the operating-cost question directly, provided the PDU or meter isolates the server being studied.
The 600W output rating is a capacity ceiling subject to conditions, not a target operating point. Confirm from the module’s actual datasheet whether its rating changes with input voltage, ambient temperature, airflow, or other limits. A server that averages modest power may still require substantial short-duration capacity for startup or workload peaks. Energy budgeting and capacity qualification should share data but should not be collapsed into one average.
A day measured at one wattage is usually the wrong day
For a meaningful energy estimate, record the activities that occupy real time. A small business server might spend long periods near idle, run scheduled backups, process a short compute burst, and then return to a lighter state. The actual pattern depends on the platform and application. Measure at a cadence that captures those changes, and retain the time zone, hardware configuration, ambient condition, and active power policy with the dataset.
Suppose a hypothetical server draws 180W AC for 18 hours and 360W AC for 6 hours each day. Its daily energy is 180W × 18h plus 360W × 6h, or 5.4kWh. Over a 30-day month that pattern would total about 162kWh. This example is not a prediction for a 600W PSU or a Powernexu product. It shows why multiplying a 600W nameplate by 24 hours gives a misleading 432kWh for the same hypothetical month. Apply the site’s tariff and any demand or time-of-use rules separately to estimate cost.
The distinction between average power and energy is important: watts describe the rate at a moment; kilowatt-hours accumulate that rate over time. A one-minute peak can matter to capacity and branch protection but contributes little to monthly energy. A moderate load held for most of the day can dominate the electricity bill. Both should appear in the engineering record, under different headings.
Collect enough days to include maintenance jobs, backups, batch schedules, and typical business cycles. If the server’s workload is seasonal or configuration is expected to change, say so. A week of monitoring may be a strong baseline for a stable service and a poor one for a quarterly analytics run. An estimate is most useful when its coverage and missing events are visible.
Efficiency is a curve, not the badge on a carton
PSU conversion efficiency varies with load, input voltage, and the exact tested model. A single peak efficiency figure cannot be applied indiscriminately to every hour. In a 600W unit, a 120W DC output corresponds to 20% of nominal rating, while 300W corresponds to 50%; the conversion loss at those points may differ. The right curve or test report is specific to the model, input condition, and configuration. When that information is unavailable, use measured AC energy for energy budgeting rather than assigning a guessed efficiency.
Efficiency classifications also need careful interpretation. A certification can document performance at prescribed test points, but the server may spend most of its time between them. Auxiliary standby consumption and system-level controls can affect the light-load result. An efficient PSU can reduce conversion loss, yet the processor, storage, cooling, and software policy often drive far larger changes in the server’s total energy use. A supply upgrade should therefore be evaluated against the server’s measured load distribution, not against a single headline percentage.
If two candidate supplies have different wattage ratings, the lower-rated one is not automatically more efficient for a given server, and the higher-rated one is not automatically wasteful. Compare their actual efficiency data at the expected DC load and the installed input service. Also confirm that each candidate can safely serve the platform’s peak and required failure state. A few watts of estimated saving do not justify an unsupported module substitution or insufficient capacity.
For a broader explanation of efficiency labels and test points, see server PSU efficiency evidence. This article concentrates on translating a 600W rating into an operating-energy measurement rather than choosing an efficiency tier.
Two modules alter the arithmetic and the failure story
In a redundant server, two installed 600W modules do not mean a fixed 1200W AC draw. The modules may share load, one may operate in a cold-redundancy mode, or the platform may follow another documented control policy. Each module’s operating point affects conversion losses. Some platforms can report module-level power, while an upstream meter captures the combined AC draw. Use the host’s actual behavior and measurements rather than assuming equal sharing.
Suppose, as an illustration, a server needs 300W DC. If two modules share it equally, each may supply roughly 150W DC, subject to the platform’s control behavior. Their combined AC input depends on efficiency at those individual points. If one module supplies the load while the other remains on standby, the active unit’s efficiency and the standby unit’s input consumption shape the total. Without the model’s data or a meter, it is not sound to declare either mode cheaper.
Fault-state capacity is another matter. In a true 1+1 arrangement, one surviving module must support the protected load under the documented input and thermal conditions. A server that normally draws far below 600W AC may still fail this requirement if the DC peak, transient demand, or derating exceeds one module’s supported envelope. Conversely, a high but short AC peak does not by itself prove the DC load exceeds the rating. Observe the relevant boundaries and use platform-approved tests.
Measure the rack feed before and after any authorized redundancy-mode change, and record whether workloads were held constant. A change in power policy can alter CPU performance, fan behavior, or workload placement, making a simple before-and-after PDU comparison misleading. Operating cost, protected capacity, and service continuity should each have their own acceptance criterion.
Build a measurement plan that survives scrutiny
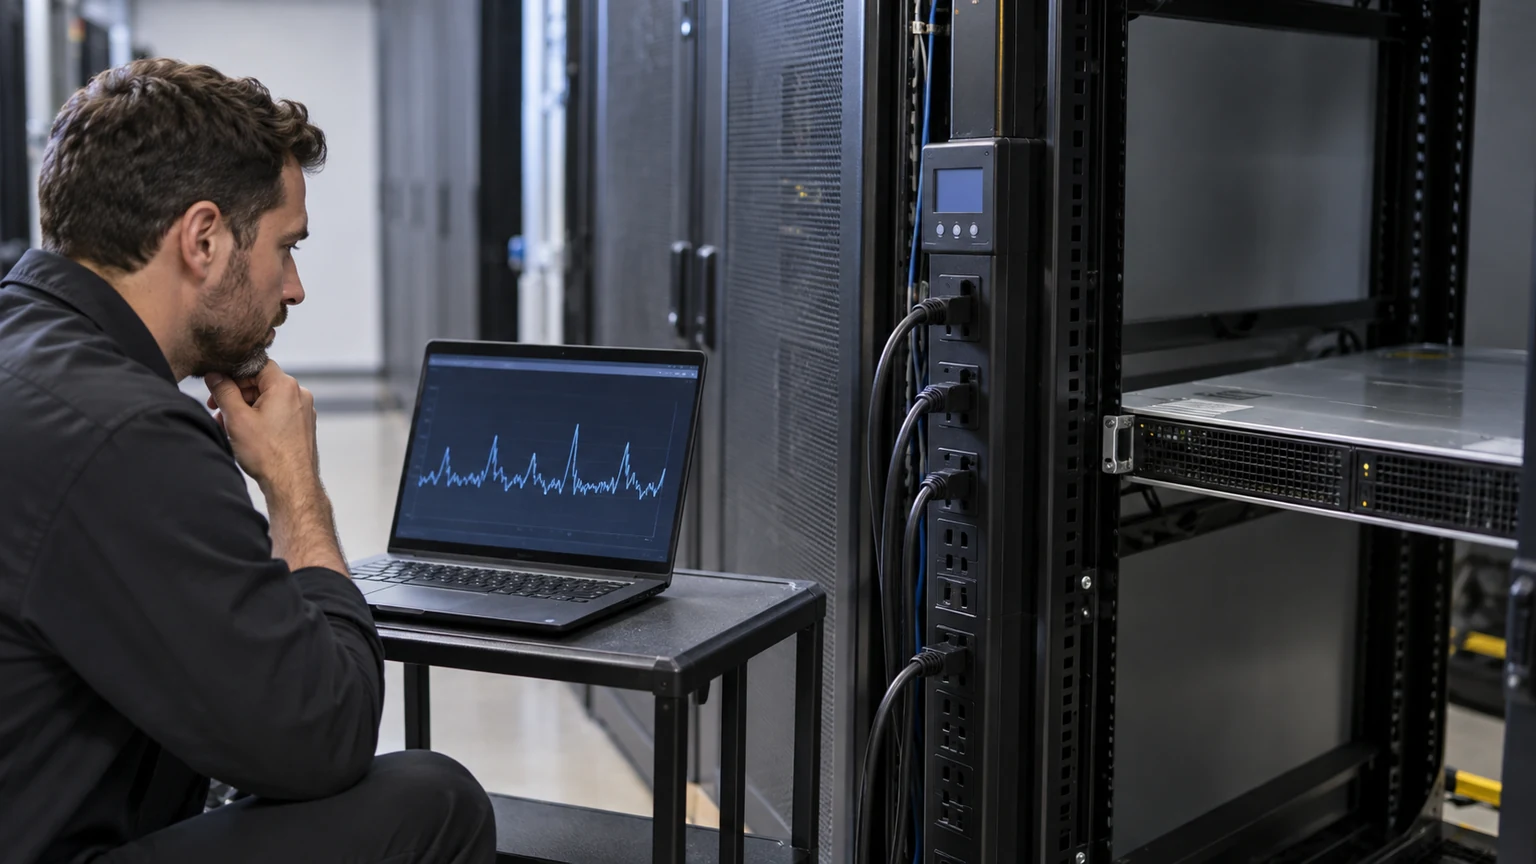
Start with a meter whose accuracy and logging interval suit the question. To calculate monthly energy, an outlet-level AC energy log is often more useful than a handheld reading at one moment. To investigate a startup trip or short load spike, a faster measurement path may be needed. Keep the equipment and calibration context in the record, especially when differences between candidate PSUs are small.
Isolate the target server. If a PDU outlet also feeds a switch or storage shelf, the total cannot be attributed to the server without a separate measurement. Record input voltage because both current and conversion behavior may change with the source. Note chassis population, firmware, fan policy, power caps, and virtualized workload placement. A processor upgrade or an added drive bank can invalidate an old baseline even if the PSU module remains identical.
Use a small set of named operating states: idle after services settle, normal production, a documented busy interval, scheduled maintenance work, startup, and any approved single-module state. The point is not to impose the same stress workload on every server. It is to make clear which observed states represent ordinary energy use and which identify a capacity boundary. A power trace should be paired with workload telemetry so unexplained changes can be investigated rather than averaged away.
For a fleet, multiply a per-server estimate only after grouping similar hardware and workload patterns. Ten servers with the same 600W PSU label may have different CPU generations, storage, utilization, or cooling policies. A small sample can be useful if those differences are acknowledged and sampled deliberately. Report a range when the fleet mix or future load is uncertain; do not manufacture precision from a single measured unit.

Turn the numbers into two decisions
The energy decision asks what the server consumed over a representative interval and how changes to workload, power policy, or PSU efficiency would affect that total. The capacity decision asks whether the exact 600W module and host distribution can support startup, peak operation, environmental limits, and the intended failure state. Record AC input energy for the first; use model-specific DC output, interface, and platform evidence for the second.
A concise handoff can list the PSU and host identifiers, input service, meter boundary, observation dates, workload states, average and peak AC readings, total kWh, and any efficiency assumptions used to infer DC power. Place the power-policy and redundancy observations beside those numbers. If the available data covers only a quiet week, label the estimate provisional and identify the missing busy period.
A 600W server power supply is thus neither a 600W electric bill nor proof of a 600W continuous workload. The rating tells you what output capacity to investigate. The meter and operating profile tell you what energy the installation actually uses.