How much power does an AI server rack consume? There is no reliable single figure without a defined rack population, workload, and measurement boundary. For operating cost, the useful quantity is the rack’s measured electrical energy in kilowatt-hours over time. For electrical capacity, it is the highest supported input power under the relevant operating and failure conditions. Add up active power measured at the rack feeds, then watch how that total changes over an actual training, inference, or idle cycle. Do not add the wattages printed on every installed PSU: those are output capabilities, not a record of what the rack draws from AC power.
Four rack numbers that look similar but answer different questions
An AI rack can carry many wattage figures on its equipment schedules. Each belongs to a different boundary. The sum of installed PSU ratings describes potential converter capacity under stated conditions. The rack PDU’s rating describes how much electrical input a distribution path is permitted to carry. A power meter on that path reports current electrical draw. Its accumulated kilowatt-hours report energy used during an interval. Only the last two describe consumption, and even those require the meter’s location to be known.
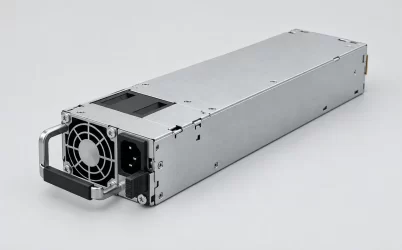
Consider a server with two hot-plug supplies rated at 2,000 W each. A purchase list might show “4,000 W installed.” In a 1+1 configuration, however, the second supply is there to preserve service after a module loss; it does not double the server’s normal demand. If that server currently pulls 2.4 kW from its AC inputs, the rack sees about 2.4 kW from it at that moment, not 4 kW. The example is deliberately hypothetical. A real platform’s rating, redundancy mode, measured AC draw, and permissible failed-state load must come from its own records.
Measure at the rack feed, then name what the meter includes
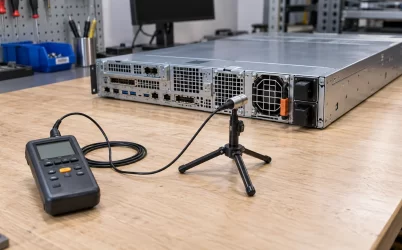
For a rack supplied by monitored rack PDUs, start with their real-power readings in kilowatts. Include every feed serving the rack, whether the connection is single-phase or three-phase. If two feeds serve a redundant design, normal operation may split load between them. Sum the simultaneous measurements when estimating the rack’s present AC input. A reading from only feed A can understate total demand while both feeds are healthy; adding two readings taken at different times can create a false peak.
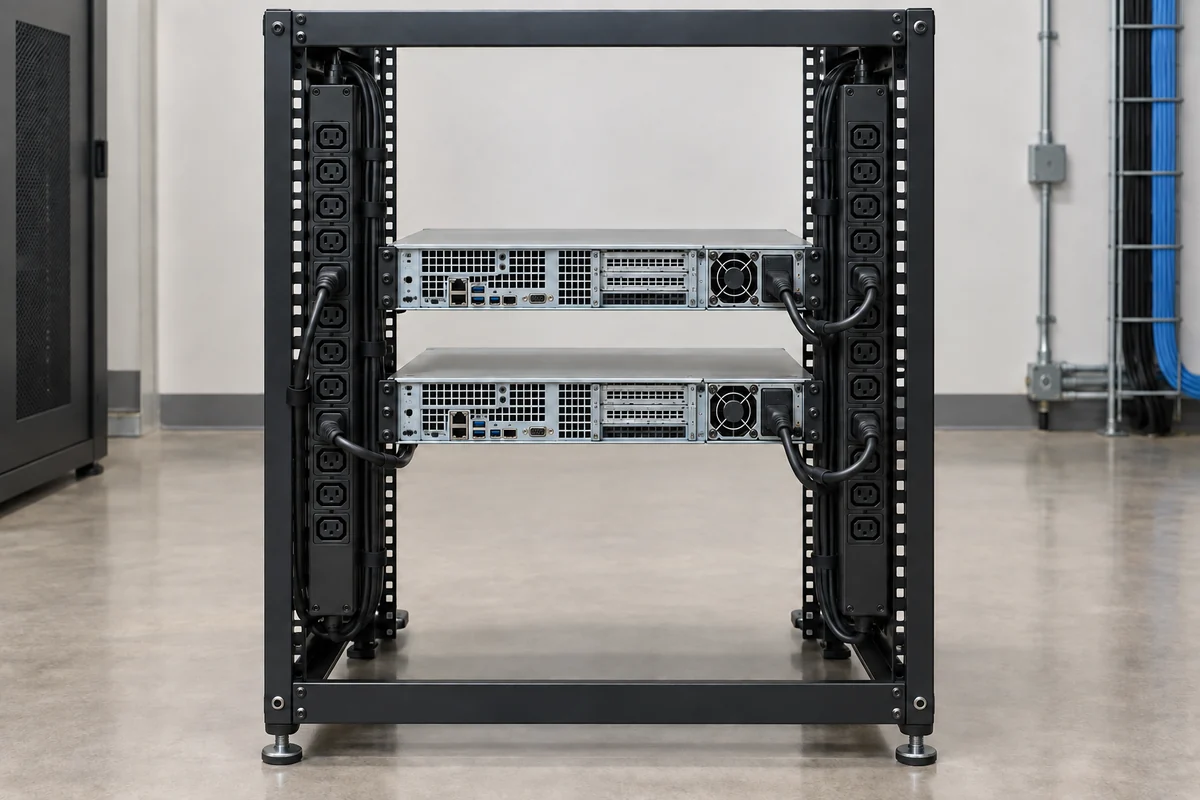
The location of the measurement matters. An inlet meter on a rack PDU can include the PDU’s own distribution losses, while a set of outlet readings may represent the devices connected to those outlets. A meter upstream of a shared panel may include several racks or non-IT loads. When the planning question concerns power delivered to one AI rack, select the boundary that actually encloses that rack and state whether PDU losses are inside it. That sentence beside a chart prevents an otherwise precise number from being misused later.
Three-phase service adds another trap: volts multiplied by amps is not necessarily the real power billed or dissipated by the IT equipment. Power factor and the phase arrangement affect the relationship between apparent power in kVA and active power in kW. A monitored PDU that reports real power per phase or per inlet is preferable to inferring rack kW from one clamp-current reading. Uneven loading can also hide behind a plausible total. A 14 kW rack may have a heavily loaded phase or outlet group even though the aggregate seems acceptable.
Outlet telemetry can identify which node, storage shelf, network device, or cooling accessory contributes to the load. It is not always necessary to meter every cord to know a rack’s total, but per-outlet data can explain a jump that rack-total metering alone cannot. When a node has dual power cords, join those two outlets before comparing its measured input with a server-level expectation. Do not read a single cord as the node’s complete demand unless the platform is operating on that cord alone.
AI workloads turn a nameplate into a time series
“AI rack consumption” is not one steady value. A rack may spend part of a day loading data, part executing compute, part waiting for work, and part processing short requests whose concurrency changes rapidly. GPU utilization is relevant, but the AC meter sees more than GPU silicon. CPUs, memory, networking, storage, fans, pumps where applicable, and conversion loss all contribute. Even two jobs with similar accelerator utilization can differ at the rack feed if their data movement, precision, fan behavior, and scheduling differ.
A single instantaneous reading can therefore be accurate and still be unrepresentative. For energy forecasting, collect interval data across the operating modes the site expects to repeat. A minute-by-minute log can expose workload waves; a longer aggregation may be appropriate for billing or historical trend. The sampling interval should be short enough to capture the operational peak relevant to a breaker or PDU, while energy estimates need sufficient duration to represent low-load and high-load periods. Neither a short burst peak nor a quiet overnight average is an all-day consumption figure.
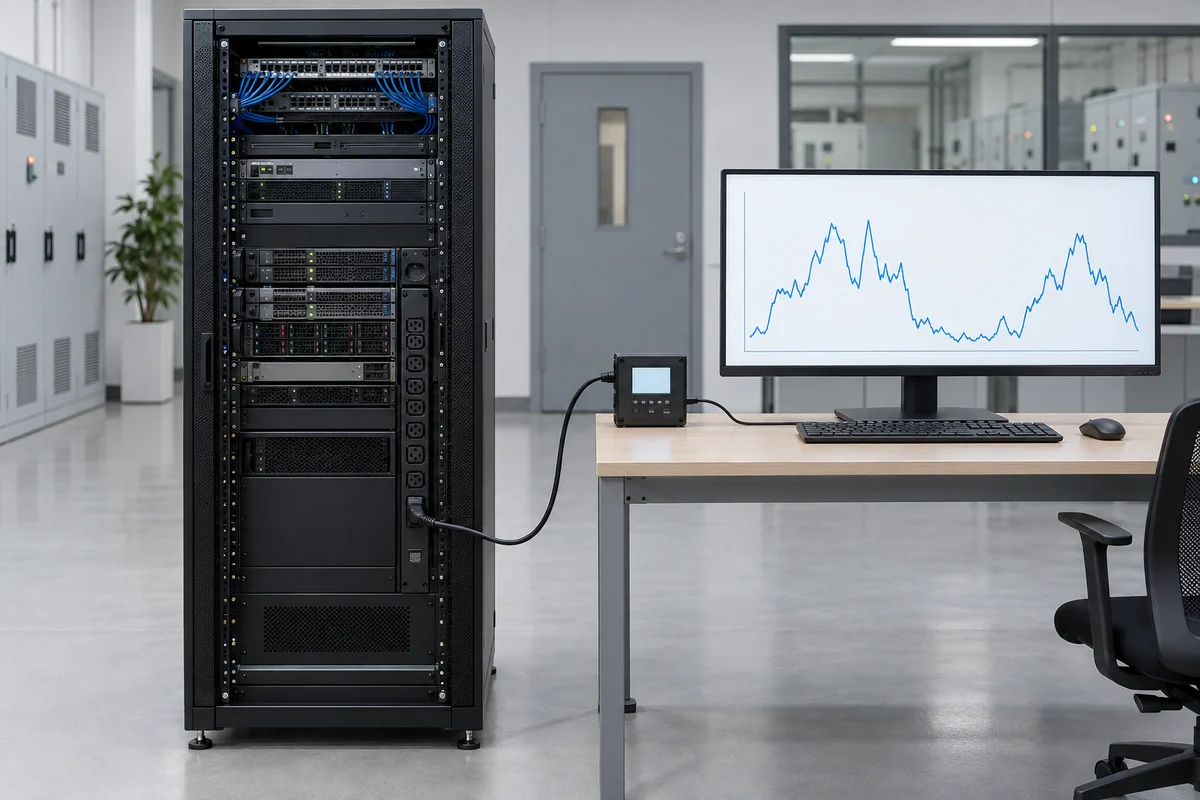
Training clusters may synchronize computational phases across many nodes, raising rack demand together. Inference racks can vary with query volume and model residency. Power caps, workload schedulers, thermal controls, and equipment failure policies can change the curve. State the active policy with the measurement; otherwise a future reader cannot tell whether a lower trace reflects an efficient workload, an enforced power limit, or idle hardware. This article does not prescribe a universal multiplier for AI versus conventional servers because the configuration and software duty cycle decide the actual draw.
Peak planning still needs a definition. A facility engineer may care about the maximum sustained real power over a specified interval, while a server integrator studies faster transients inside the device. The rack PDU log may not capture subsecond events that a server PSU or power shelf must tolerate. Conversely, a millisecond-scale component spike is not by itself a continuous rack-feed demand. Use the measurement timescale suited to the equipment whose limit is being assessed.
From kilowatts to kilowatt-hours: a transparent rack example
Suppose a hypothetical rack is measured at 13.6 kW of total AC real power for eight hours of a daily high-load window and 7.0 kW for the other sixteen hours. Its daily electrical energy at that measurement boundary is 13.6 × 8 + 7.0 × 16 = 220.8 kWh. Over thirty identical days, that would be 6,624 kWh. The values are illustrative, not a Powernexu test, a typical AI-rack specification, or a forecast for a particular hardware platform.
This arithmetic is intentionally separate from PSU labels. It uses measured AC input, so conversion loss inside the supplies is already included in the readings. Adding a second efficiency penalty would count that loss twice. If the rack has a power shelf and its AC input is included in the PDU total, the shelf’s own conversion loss is included as well. If a shared external rectifier sits outside the meter boundary, the rack reading may instead reflect DC delivery or only some downstream loads; the energy boundary must be redrawn before using the same calculation.
The example’s greatest uncertainty is not multiplication. It is whether the assumed eight-hour and sixteen-hour pattern resembles production. A rack that remains busy through weekends has a different annual energy curve from one with scheduled training windows. An inference rack can peak during short regional events while spending long periods lightly loaded. To improve a forecast, replace the two invented levels with measured distributions from representative weeks, then account for expected changes in node population and workload policy. Keep the assumptions visible rather than presenting a single annual number without its operating history.
Energy cost can be estimated by multiplying a defensible kWh forecast by the applicable tariff structure, but a single flat rate may conceal demand charges, time-of-use rates, and contract terms. Cooling and upstream distribution add facility energy outside a rack IT measurement. Those quantities should not be silently appended as if the rack PDU had measured them. They belong to the facility accounting boundary and should be calculated from site data.
Capacity must still survive a feed or module loss
Measured consumption under normal conditions does not by itself establish a safe rack feed design. In an A/B architecture, each path may carry roughly part of the rack’s load while both are present, depending on the servers and distribution scheme. After feed A is lost, feed B may need to carry all protected equipment. A design that averages 14 kW across two feeds cannot assume that each feed only needs 7 kW of capacity. The actual post-fault demand, protective-device limits, connector ratings, PDU ratings, and permitted operating policy decide what survives.
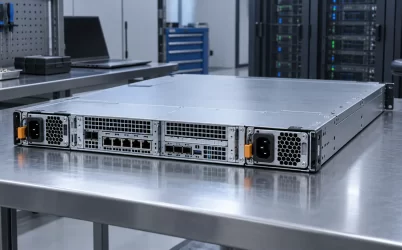
The same logic applies inside servers and rack power shelves. Two installed PSU modules can share the normal load but leave one module responsible for the defined protected load after the other fails. A platform may throttle compute following a PSU or feed fault; another may continue unchanged. Both behaviors alter the rack’s measured trace and the required spare-feed capacity. Neither can be inferred from the sum of nameplate wattages. The architecture has to state whether its availability promise is full performance, reduced performance, or orderly shutdown.
Where the rack number stops and facility energy begins
A rack PDU measurement is not a whole-data-center electricity meter. UPS conversion, building distribution, cooling plants, pumps, lighting, and other facility systems can sit outside the rack measurement. The U.S. Department of Energy’s data-center design guide describes power usage effectiveness as annual facility energy divided by IT equipment energy. That is a facility-level ratio over an energy interval, not the instantaneous power draw of one rack.
It can be useful to discuss a site’s annual facility overhead alongside AI-rack energy, but multiplying a rack’s momentary kW by a published or assumed PUE does not produce a direct measurement of that rack. PUE changes with facility loading and operating conditions, and shared infrastructure is not physically metered to one cabinet by default. If cost allocation requires a rack share of facility energy, state the allocation method and use the site’s measured energy data. Keep the directly metered rack kWh visible beside any allocated estimate.
The boundary is also important when comparing architectures. A server-level AC PSU and a shared rack power shelf may place conversion stages on opposite sides of a selected meter. A drop in one meter’s reported kW could reflect a moved loss rather than a more efficient total path. Compare like boundaries or add the measured upstream stage. An energy claim that ignores where conversion moved is not an improvement claim.
What a useful rack power record looks like
A useful operating plot labels both axes and its electrical boundary: simultaneous A and B inlet real power, their combined kW, and energy accumulated over the chosen interval. Mark major changes in rack population, power-cap policy, firmware, and workload schedule. The plot then explains why the rack used a certain number of kilowatt-hours and whether the peak that matters to distribution equipment changed. No generic “AI rack wattage” table can substitute for that evidence across unlike systems.
When a new rack is not yet installed, the first estimate can use vendor-supported server input-power data and an explicit workload/population scenario. Keep that provisional estimate distinct from the later meter trace. A nominal PSU output rating may help establish possible capacity and failure-state support, but it is a poor proxy for daily energy. Once measured data exists, compare it with the planning envelope: perhaps the normal draw is lower than forecast yet the surviving feed still needs the originally designed capacity. That is not a contradiction. Consumption describes what the rack did; capacity describes what it must safely be able to do.