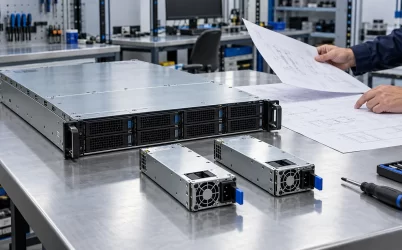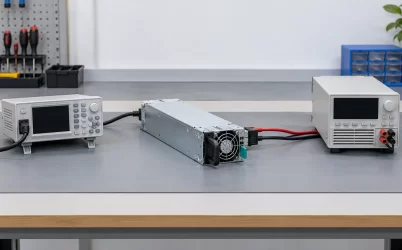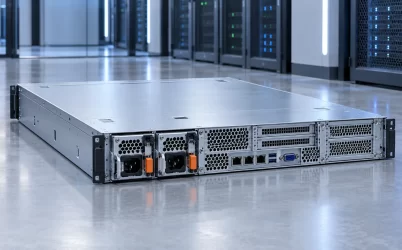
For a redundant server, 80 PLUS Platinum versus Titanium is an efficiency comparison, not a choice between a compatible and an incompatible power supply. In the 230 V internal redundant category, Titanium has a higher minimum efficiency at the 20% and 50% test points, while the published minimum at full load is the same for both tiers. Titanium also has a defined 10% point. Those differences may reduce input energy and heat, but the size of the benefit depends on the actual modules, load distribution, input conditions, and hours spent at each load. A Titanium label does not change a chassis connector or guarantee that a server accepts the module.
Compare the same 80 PLUS category before comparing the badges
“Platinum” and “Titanium” are not single worldwide efficiency numbers. The 80 PLUS program publishes different categories for, among others, 115 V non-redundant, 230 V EU non-redundant, and internal redundant data-center supplies. A threshold from a desktop PSU chart cannot be transplanted onto a redundant server module. The relevant starting point is the certification record for the exact power-supply model and its input category. A reseller description containing “Titanium” without a matching record is not a substitute for that identity.
For the program’s 230 V internal redundant category, the published minimum efficiencies are 90%, 94%, and 91% at 20%, 50%, and 100% of rated output for Platinum. The corresponding Titanium minimums are 94%, 96%, and 91%. Titanium additionally lists 90% at 10% load; the program labels the below-Titanium 10% figure in this category as suggested rather than treating it like the other comparison points. These are certification thresholds, not promised operating efficiencies for every unit installed in a hot server. The official 80 PLUS ratings table identifies the category and the load points together.
| 230 V internal redundant test point | Platinum minimum | Titanium minimum | What differs |
|---|---|---|---|
| 20% of rated output | 90% | 94% | Four percentage points in the published threshold |
| 50% of rated output | 94% | 96% | Two percentage points in the published threshold |
| 100% of rated output | 91% | 91% | No difference in the published minimum |
The table does not mean every Titanium module is exactly two points better than every Platinum module at half load. A particularly efficient Platinum unit may outperform its tier’s minimum, and two certified products may have different efficiency curves between the published points. Read their individual reports or measured curves when the energy difference matters. Also check the input-voltage category: a result recorded at a particular test input does not establish the same performance at every site voltage or during a low-line event.
Power factor is reported alongside efficiency in the program, but it answers a different electrical question. Efficiency compares real input watts with DC output watts. Power factor describes how real input power relates to apparent input power at the AC source. A better power factor can matter to upstream distribution capacity, yet it does not make the PSU’s conversion loss equal to zero or automatically change the server’s DC output requirement. Keep those two metrics separate when reading certification tables; a single percentage in a sales listing can otherwise obscure which quantity it describes.
Where the operating hours sit on the curve matters more than the tier name
Server load is not a fixed percentage of the PSU nameplate. CPU utilization, memory, storage, network cards, accelerator activity, and workload scheduling move the DC demand. Redundant modules can divide that demand, placing each supply at a lower percentage of its individual rating than a single-module calculation suggests. Some platforms alter active-module behavior to avoid very light loading; that behavior depends on the host and supported supplies and must not be assumed from the efficiency badge.
Consider a server drawing 1,000 W of DC output through two 2,000 W modules that share current evenly. Each module would then deliver 500 W, or 25% of its own rating, in this simplified example. The system is not at “50% PSU load” merely because 1,000 W is half of one module’s rating. Its per-module operating points sit near, but not exactly on, the 20% certification point. If the host instead runs one active module while the other remains available, the active supply operates near 50%. An efficiency comparison must use the actual current-sharing state and the individual module’s output, not just total server power.
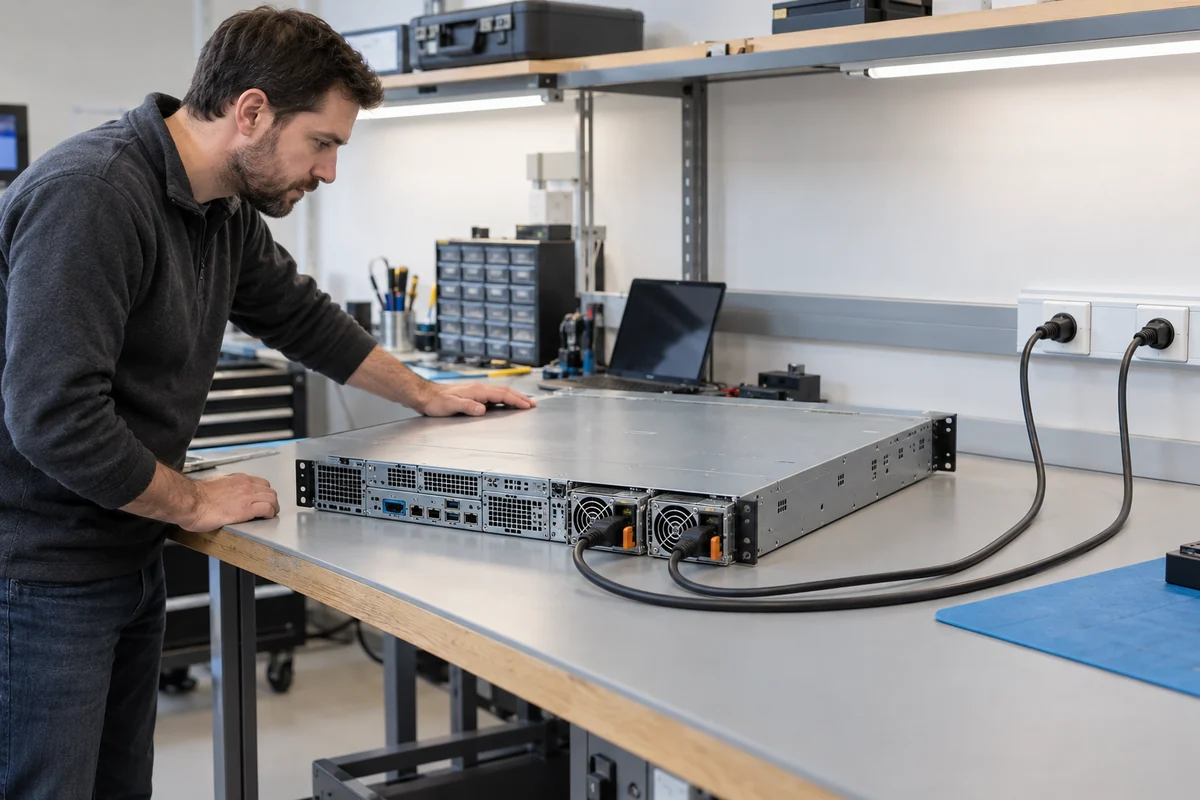
That distinction can reverse the apparent importance of the published gap. A lightly loaded pair may spend long periods below the most favorable part of either curve, while a heavily loaded surviving module moves toward a different region after a fault. The 10% Titanium test point is informative for systems that genuinely operate near that point, but it is not evidence that any particular Platinum unit performs poorly there. Ask for the actual test data or estimate the duty-cycle distribution from management telemetry when possible.
For a mixed workload, divide representative operating time into useful bands—idle or low service load, normal production, burst periods, and the single-module condition if redundancy is required. The point is not to fabricate a perfect annual histogram. It is to avoid paying for a presumed 24/7 improvement at 50% when the modules rarely operate there. Even a rough, honestly bounded distribution is more useful than applying one certificate number to every hour.
Translate an efficiency gap into heat and electricity without overstating it
Conversion efficiency is DC output divided by AC input. For a fixed DC load, input power equals DC output divided by efficiency; the difference between input and output becomes loss in the power-conversion path. A PSU with lower conversion loss generally adds less heat to the local air stream. However, 80 PLUS certifies PSU efficiency under specified conditions, not total rack cooling energy or server-level energy. Fans, voltage-regulator losses, distribution, UPS losses, and cooling-system response sit outside that simple equation.
As an illustrative threshold calculation, suppose a 2,000 W module delivers 1,000 W at the 50% point and compare units operating exactly at the respective 230 V redundant minimums. At 94% efficiency, input is about 1,064 W and conversion loss about 64 W. At 96%, input is about 1,042 W and conversion loss about 42 W. The difference is roughly 22 W while that specific output and condition persist. This is not a claim about any named product; real certified units may exceed the minimums by different amounts.

If that exact 22 W difference continued for 8,760 hours, it would represent about 193 kWh of input energy over a year per active module. Multiply by a local energy price to estimate only the direct electrical part of the comparison. Do not call the result a guaranteed payback: server load varies, the two models may not share the same curve, energy prices differ, and the purchase price gap is product-specific. For fleets, multiplying a measured representative delta by the number of comparable systems is sensible only after confirming the fleet actually uses the same configuration and workload pattern.
A practical cost comparison also has a time horizon. A server being refreshed soon cannot realize the same cumulative benefit as one expected to remain in service for several years. Spares policy can change the economics as well: stocking an additional module type for a small efficiency gain may add operational complexity, while a standardized, approved Titanium fleet may simplify replacement. Neither effect is captured by the 80 PLUS grade. Put them beside, rather than inside, the energy calculation so the mathematical result remains transparent and the purchasing judgment stays honest.
At 100% output the published minimum in this particular category is 91% for both tiers, so one cannot infer a minimum-tier advantage from the badge at that test point alone. A real Titanium model may still test better than a real Platinum model there; the individual report decides. At lower load the relationship also cannot be accurately interpolated with a straight line between certificate points. If a site’s cost model hinges on a small percentage difference, measured data at the operating point matters more than a generic tier table.
Efficiency is not a replacement for a qualified server configuration
A removable PSU is part of a host electrical and mechanical system. The replacement must match the approved bay and mating connector, output architecture, control signals, firmware behavior, input range, airflow direction, and service arrangement. Platinum and Titanium modules with the same advertised wattage may still differ in depth, latch, pin assignment, standby rail, telemetry, fan control, or supported host generation. An efficiency upgrade that prevents the second module from sharing current or reporting correctly is not an upgrade.
It is also possible for two modules to carry the same efficiency tier while having different allowable output at different AC inputs. If the site has 120 V circuits but the certificate comparison was made in a 230 V redundant category, do not infer full rated output or identical efficiency from the badge. Confirm both the input rating and the host’s supported-module list. For an existing rack server, the approved spare part or platform documentation is usually more decisive for fit than a generic capacity and efficiency description.
Redundancy changes the capacity question as well. Two nominally equal modules in a 1+1 arrangement are normally intended to preserve the required load after one fails; their printed wattages are not automatically additive as continuously usable server capacity. A lower-loss Titanium candidate must still carry the failure-state load under the available input and cooling conditions. If an upgrade involves a different PDB, harness, cage, or module population rule, it has crossed from an efficiency comparison into a platform integration project.
Power quality and reliability also should not be inferred from the efficiency grade. The program’s conversion-efficiency and power-factor requirements do not, by themselves, establish output-ripple suitability, hold-up behavior, transient response, protection coordination, acoustic performance, mean time between failures, or hot-swap compatibility. Those questions belong to the model specification and the server platform. A well-matched Platinum unit can be the technically correct replacement where an unrelated Titanium unit is not supported.
Choose the upgrade for the workload actually being powered
For a new platform with two otherwise compatible and approved PSU options, Titanium is most attractive where its measured curve improves the many hours the modules actually operate, where electricity or thermal headroom has meaningful value, and where the additional purchase cost is justified by that specific duty cycle. It may also be useful when many identical servers make a small per-module loss reduction material in aggregate. The defensible comparison uses the same output load, the same input category, and verified product data for both candidates.
Platinum may remain the better choice when a supported replacement is readily available, the server’s duty cycle gives only a small measured advantage to the Titanium alternative, or the proposed Titanium module requires a different host configuration. This is not an argument that the Platinum tier is universally sufficient. It is a recognition that a certification tier is one property of a PSU, not a platform qualification statement or a universal electricity bill.
Where the server runs predominantly at very light load, avoid assuming the 50% table entries describe its normal operation. Where it runs near full output, note that the minimum thresholds converge at 100% for the 230 V redundant category and use individual test reports to see whether a real advantage remains. Where redundant modules share current, derive the load percentage for each active module. These three workload shapes give different answers to the same Platinum-versus-Titanium question without changing the labels on either supply.
The practical result is a comparison between two identified, host-supported modules, not between two words printed on a product listing. Match the exact 80 PLUS category and model record, map the server’s operating load to each module, and compare actual efficiency data where available. Then the badge can do its proper job: summarizing a tested minimum for a defined category while the server configuration and workload determine how valuable that minimum is in service.