To measure DC–DC converter output ripple and noise, match the observation to both the specification and the behavior being investigated. A short oscilloscope record can reveal switching detail while missing a slower change in output voltage. AC coupling can make small variations easier to display, yet conceal low-frequency information. A clean-looking trace therefore needs two qualifications: what frequencies reached the channel, and what interval the acquisition actually observed. Neither is answered by the peak-to-peak number alone.
This becomes particularly useful at light load, where a converter may use a documented operating mode with intervals between energy-delivery events. The objective is to preserve both the local detail and the longer voltage trajectory, without treating every converter as though it uses the same pulse pattern. Start with the selected device’s mode description and the requirement for the exact output being measured.
Choose the voltage question before the display settings
A ripple compliance measurement and an investigation of a slowly changing rail are related but different tasks. The first follows the manufacturer’s specified output point, load conditions, bandwidth, and connection method. The second asks whether the receiving circuit experiences a meaningful voltage movement during its operating interval. One arrangement may support both, but that needs to be established rather than assumed from a familiar oscilloscope setup.
In a server, a local DC–DC output is also a different boundary from the removable PSU’s main bus. The conversion stages inside a server explain why distribution and point-of-load regulation separate those locations. Identify the converter output and its intended return, then identify whether the requirement applies there or farther downstream at a load. The present question concerns the time and frequency information retained at that chosen node.
Keep the average voltage requirement visible alongside the ripple question. A small variation about an incorrect setpoint is still an incorrect rail. Conversely, a satisfactory average does not establish that brief or recurring excursions remain within the receiving device’s limits. These statements are compatible because they describe different features of the same voltage history.
The initial record should name the input condition, output load, converter mode where known, and whether that load remained steady. A processor entering a lower-power state can change both demand and the converter’s operating behavior. If those changes occur while the capture settings are changed, the resulting traces cannot isolate the measurement effect. Hold the operating condition as consistently as the application permits.
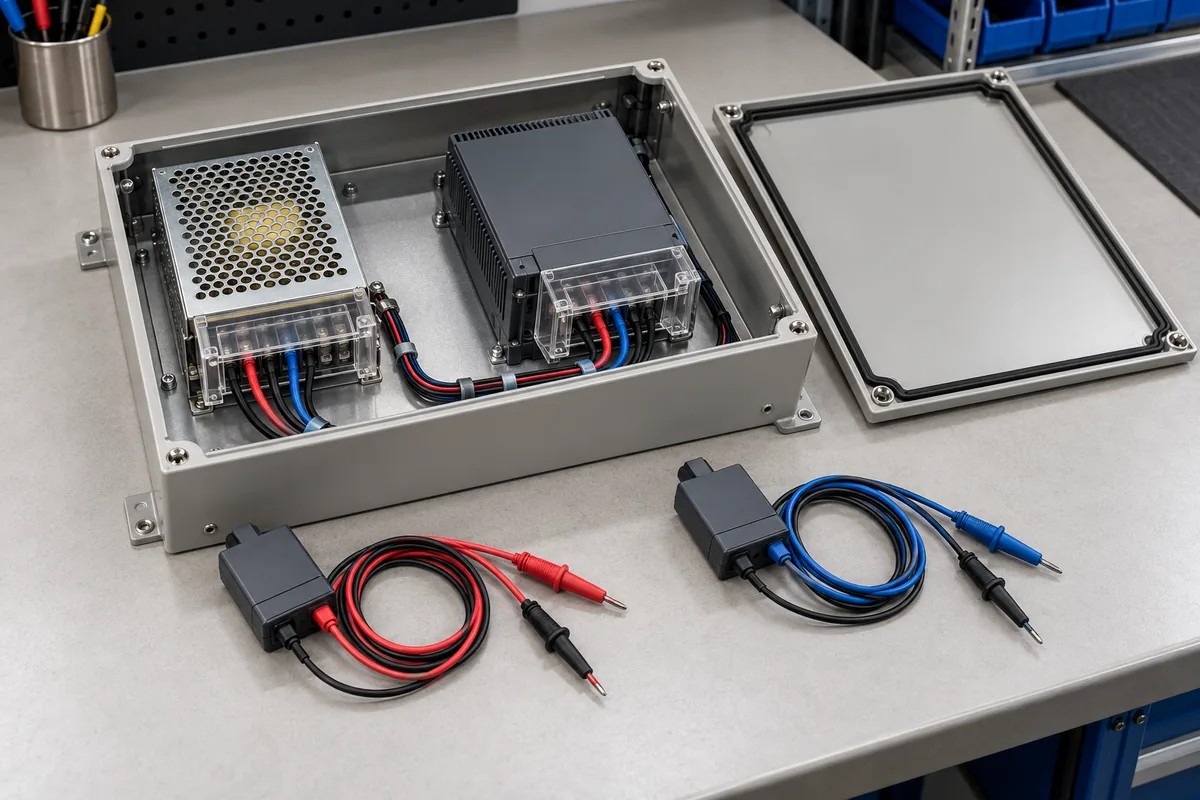
A light-load output can carry more than one time scale
An exact manufacturer example makes the distinction concrete. Analog Devices describes low-ripple Burst Mode operation in the LT3971A/LT3971A-5 datasheet: single current pulses charge the output capacitor, which supplies the load during the intervening sleep period. Lower load reduces the pulse rate and lengthens that interval. This describes those devices and that mode; it is not a claim that every DC–DC converter produces groups of pulses or uses the same light-load control.
For that kind of operation, the output has a history between energy-delivery events as well as behavior around each event. A view centered tightly on one pulse answers a different question from a view covering several intervening intervals. The former can reveal local voltage detail. The latter shows whether the chosen event is representative of the recurring output trajectory under that load.
Now consider a hypothetical investigation with no assumed component values. An engineer triggers on an energy-delivery event and displays a short interval around it. The screen looks repeatable because every acquisition begins at a similar point in the behavior. Extending the observation may reveal a longer separation between events than the original display showed. The first trace was not necessarily wrong; its visible interval simply did not answer the longer-term question.
The load also belongs to this interpretation. If demand changes, the timing of the selected converter’s documented light-load behavior can change. A capture obtained at one quiet operating point should not be presented as the maximum ripple across an application’s entire load range. Describe the tested state and distinguish it from the states that remain unobserved.
Other devices may use different control modes, transition rules, or pulse arrangements. Read their own documentation before naming an observed pattern. A repeating output feature could also involve changing load demand, an upstream disturbance, or a measurement effect. The existence of light-load modes gives a reason to examine the longer history, not a license to diagnose every slow variation as burst operation.
AC coupling and bandwidth remove different information
Tektronix’s power-rail measurement note explains that AC coupling removes the DC component but can also obscure low-frequency events such as droop. With sufficient offset capability, DC coupling can retain that slower information while displaying the small variations on a rail. Its examples illustrate a measurement limitation; they do not establish one universal AC-coupling cutoff for all instruments and probes.
That distinction matters when two people both say that they limited bandwidth. An upper bandwidth limit excludes sufficiently fast content. AC coupling changes the low-frequency response as well as removing the DC level. The settings address different ends of the observation range. Matching one setting does not establish that two measurement chains preserve the same information.
A slow change can therefore appear reduced or reshaped in an AC-coupled view. The appropriate response is to examine the documented channel and probe response, not to invent a correction factor from the displayed trace. If the investigation concerns the rail’s absolute level or slow movement, use a suitable arrangement that preserves that information and respects the instrument’s limits.
DC offset is a capability, not permission to connect any probe to any voltage. Check the probe and channel’s permissible differential and reference conditions, input range, offset range at the chosen sensitivity, and loading. Those are independent constraints. A display that can be centered around the desired voltage does not establish that its connection is electrically appropriate.
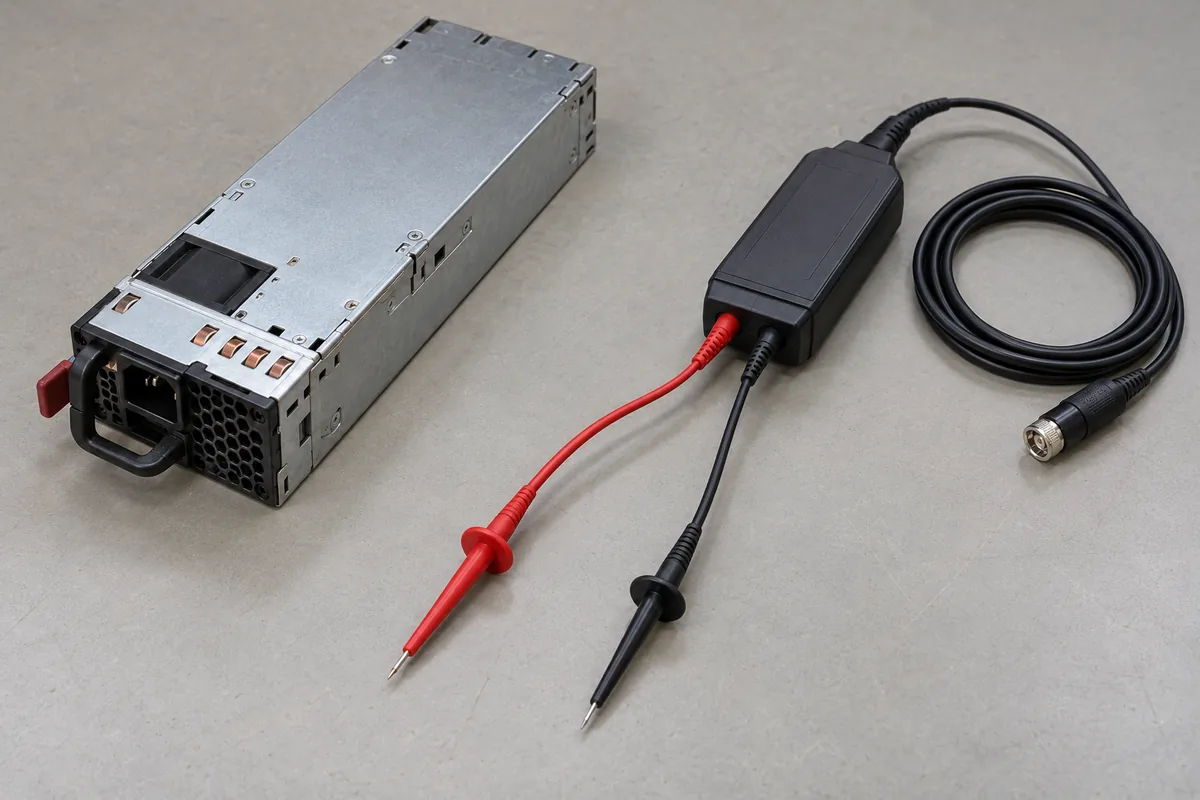
Do not declare AC coupling universally unsuitable. It can serve a defined ripple observation when its response and the specified measurement method fit the question. The error is using an AC-coupled small-signal view to make a claim about slow droop or absolute rail limits that the setup did not retain. Preserve the scope of the result.
Use a longer observation and a detailed view together
Begin with enough temporal context to identify the behavior that needs explanation. The required duration follows the recurring event or equipment state, not a universal timebase setting. A longer observation can establish whether energy-delivery events repeat regularly, whether the spacing changes, and whether the output moves across a slower operating cycle. Its usefulness depends on what the acquisition actually retains.
Then inspect a shorter interval around a relevant event with adequate detail for the question. If the instrument supports a detailed view of the retained record, document how that view was produced. If a new acquisition is required, preserve the load and converter state and label it as another observation. Two captures can complement each other without pretending that they are the same event.
A long display is not automatically a detailed record. Record length, sample spacing, acquisition processing, and the displayed representation can affect what is available for later inspection. Check the actual acquisition information and the instrument documentation. Extending the horizontal span should not silently become evidence that every narrow feature throughout that span was resolved.
The reverse limitation applies to a short capture. Fine detail around one selected event does not establish that nothing important happened between the intervals observed. Repetition helps, but repeated captures under the same trigger can keep selecting the same part of a cycle. Make the trigger’s selection role explicit when assessing coverage.
This approach does not require two independent instruments or a particular oscilloscope feature. It requires two questions to be answered honestly: what is the output doing over the relevant operating interval, and what happens within the events that form that behavior? The available instrument must support the claimed resolution and duration, or the result should retain that limitation.
Keep the peak-to-peak result attached to its interval
Peak-to-peak voltage is the highest observed value minus the lowest observed value within the defined measurement population. Change that population and the statistic can change. A measurement restricted to a quiet portion of a cycle is not equivalent to one covering the complete recurring behavior. A record that contains a load transition answers another question again.
State whether the statistic applies to the entire retained record, a selected window, or another documented acquisition result. Do not place a value measured in one selected segment beside a screenshot of a much longer display without explaining the selection. The reader should be able to identify which observations contributed to the number.
Likewise, a smaller result after changing coupling or bandwidth is not automatically an improvement in the converter. The circuit may be unchanged while the measurement chain passes less of its behavior. To demonstrate a circuit improvement, compare equivalent observations under the same relevant operating conditions. To demonstrate a measurement difference, keep the circuit condition fixed and describe the settings that changed.
An occasional large excursion also needs context. It may be a load event, a mode transition, a real output disturbance, or pickup. Retain the event record rather than deleting the inconvenient sample to obtain a cleaner ripple number. Determine which requirement applies to that event separately from a steady-state ripple limit.
A comparison table can keep these claims from drifting. Give each observation its own row: operating condition, retained time span, coupling response, detailed event inspected, and statistic interval. If the short view and long view were acquired separately, do not combine their extrema into a new peak-to-peak figure as though both came from one continuous record. Their offset, load history, and acquisition conditions may differ. Report each result within its own boundary unless a justified method connects them.
Consider a hypothetical rail that appears quiet in repeated short captures but shows a slow level change during a longer equipment cycle. The observations are not contradictory. The short captures describe their selected intervals; the longer record describes an additional part of operation. The next decision is whether that slow change belongs to the converter mode, the commanded rail setting, or changing load demand. Timing context directs that investigation without declaring the converter defective.
Write a result that preserves what remained unseen
A useful report combines the chosen output and return location with the converter identity, mode, input, load, and observation method. Include coupling, bandwidth, sensitivity and offset arrangement, acquisition duration, retained resolution, trigger condition, and the interval used for the reported statistic. These details explain the finding rather than decorate it.
Connection quality remains a prerequisite. Keep the measurement loop appropriate to the manufacturer’s method, use a suitable reference arrangement, and account for probe loading and instrument noise. Those controls prevent an apparent spike from dominating the investigation. They do not replace the longer observation when the actual question concerns slow voltage behavior.
The final conclusion can stay narrow. A short, appropriately referenced record may establish switching detail under a defined load. A longer observation with suitable low-frequency response may establish the recurring output trajectory over the tested interval. Together they support a stronger account than either alone, while leaving untested loads and unresolved events visible. That is how a ripple measurement becomes evidence about the converter’s output instead of merely a reassuring image of a small waveform.