Server PSU efficiency is the ratio of usable DC output power to the AC input power drawn by the supply. The number matters because the difference becomes heat inside the rack: at 1,000 W of DC output, a supply operating at 94% efficiency draws about 1,064 W and dissipates about 64 W, while one operating at 90% draws about 1,111 W and dissipates about 111 W. The useful purchasing question is therefore not simply which badge is higher. It is which approved PSU delivers the stronger efficiency curve at the server’s real load, input voltage, temperature, and redundancy state.
Efficiency is a curve, not a fixed property
A nameplate efficiency value compresses a load-dependent behavior into one convenient figure. Inside an AC-input server PSU, the power-factor-correction stage, switching devices, magnetics, rectification, control circuits, and fan all consume or dissipate some energy. Several losses remain meaningful even at light load, while conduction losses tend to rise as current increases. The combined effect is normally a curve: efficiency is lower at very light load, improves across a middle operating region, and may decline again toward full load.
That shape explains why two supplies with the same rated wattage can produce different facility demand over a day. It also explains why selecting a very large module for generous headroom may increase losses if the server spends most of its life near the bottom of that module’s curve. The exact curve is model-specific; a certification tier or peak value does not reveal every operating point.
Read the operating point before reading the badge
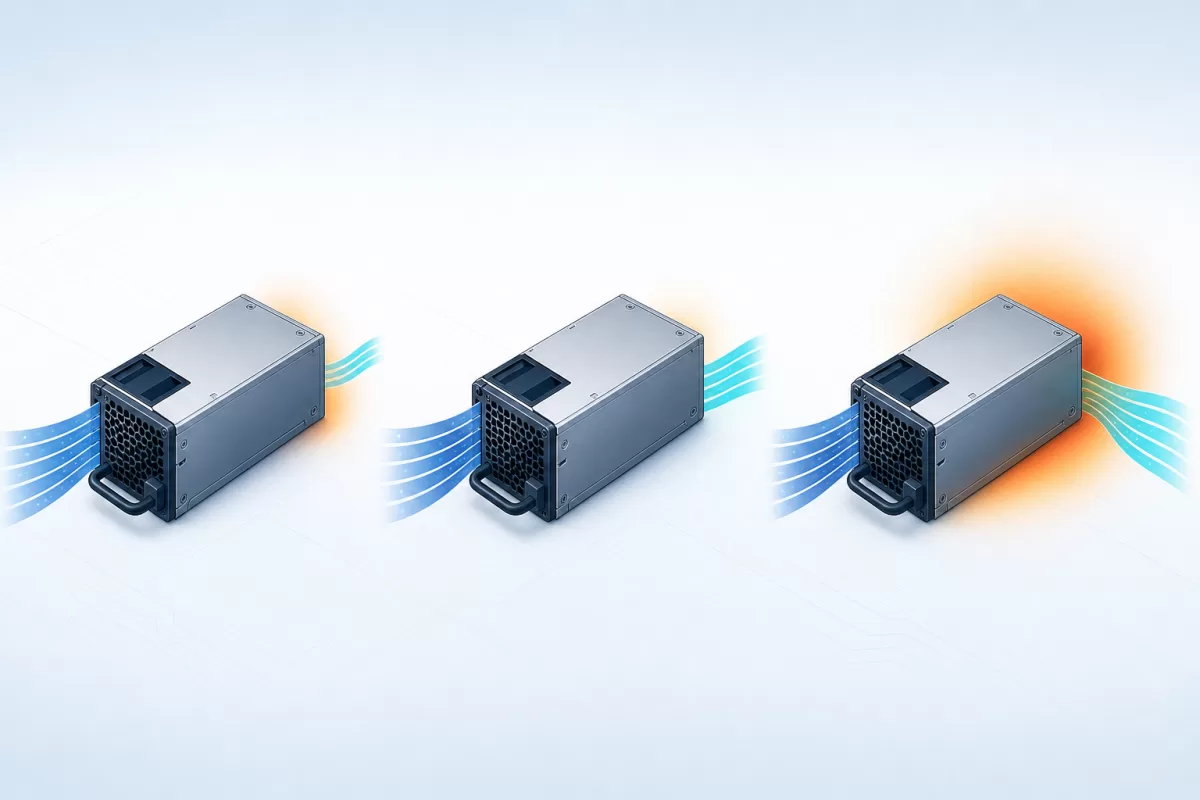
Load percentage is DC output divided by the module’s rated output under the applicable conditions. A server drawing 600 W from a 1,200 W module places that module near 50% load. In a 1+1 redundant arrangement with two modules sharing evenly, each may provide about 300 W and therefore operate near 25% load. The server load has not changed, but the operating point of each conversion stage has.
This is one reason redundant efficiency must be evaluated as a system state. Normal operation may put two modules at relatively light load. Loss of one feed or module moves the surviving supply to a higher point on its curve. A good design needs acceptable energy performance in the long-duration normal state and sufficient electrical and thermal capacity in the single-module state. Disabling or parking a redundant module can improve efficiency on platforms designed for that mode, but it changes how quickly redundancy is restored and must be an officially supported server behavior rather than an improvised operating practice.
Before comparing candidates, build a load histogram from BMC or rack telemetry. Separate idle, common workload, sustained high-load, and rare peak intervals. Average power alone can conceal a server that alternates between long idle periods and short accelerator-intensive bursts. Weighting the efficiency curve by time spent at each operating point produces a more useful estimate than comparing a single peak number.
Convert efficiency into watts of loss
The fundamental calculation is straightforward. If DC output is Pout and efficiency is represented as a decimal, AC input is Pout divided by efficiency. PSU loss is AC input minus DC output. The formula does not include upstream UPS and distribution losses, nor the energy required by cooling equipment, so it describes the conversion module rather than total data-center efficiency.
Consider a hypothetical server requiring 800 W DC for 6,000 hours per year. Candidate A operates at 92% at that server’s normal point; Candidate B operates at 95%. Candidate A draws about 870 W and loses about 70 W. Candidate B draws about 842 W and loses about 42 W. The input difference is roughly 28 W, or approximately 168 kWh over those 6,000 hours. Multiply by the number of similarly loaded servers and the applicable electricity price to estimate direct energy value. This example is arithmetic, not a claim about any particular PSU.
Cooling makes the consequence larger because nearly all conversion loss ultimately becomes heat in the room or liquid-cooling support environment. A rigorous TCO model can apply the facility’s measured cooling overhead to the avoided PSU heat. It should not assume a universal multiplier: cooling energy varies with climate, containment, economization, liquid-cooling topology, and operating conditions.
Redundant modules move together across the curve
In a current-sharing pair, small differences in module output can change individual efficiency and temperature. Balanced sharing generally keeps both modules in similar electrical and thermal states, but the platform controls the actual behavior. The power distribution board, ORing or isolation devices, standby rails, and management electronics add losses that may not appear in a bare-module efficiency figure.
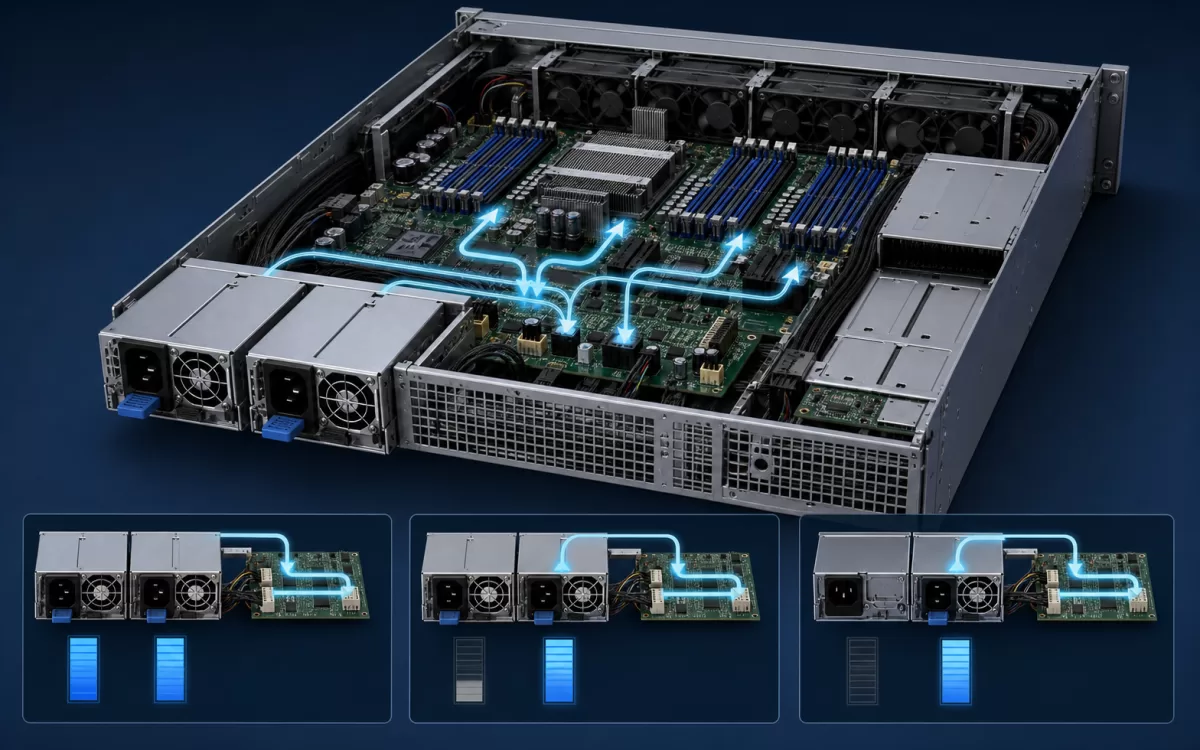
For an efficiency comparison, record at least three states: both modules online at representative workload, one module carrying the same workload, and the platform’s lowest common load. The first state dominates annual energy in many continuously redundant deployments. The second establishes how loss and exhaust temperature change during a fault. The third exposes whether oversized modules spend substantial time in an inefficient low-load region.
This treatment is intentionally narrower than a full power supply redundancy architecture analysis. Here, redundancy matters because it changes each module’s load fraction and therefore its conversion loss. Feed independence, fault containment, and service continuity remain separate architectural requirements.
Input voltage and temperature can redraw the comparison
Efficiency data is meaningful only with its test conditions. Many server supplies perform differently across their supported input range because input current, switching behavior, and conduction losses change. High-line AC commonly helps high-power applications reduce input current, but the exact efficiency benefit and available output rating must come from the model’s documentation. Never infer low-line or high-line capability from another unit in the same wattage class.
Temperature also changes semiconductor resistance, magnetic losses, fan power, and the module’s thermal operating policy. A laboratory result at one ambient condition may not predict operation in a dense rear-of-rack hot zone. If a PSU increases fan speed as temperature or load rises, the fan becomes part of the input-energy measurement. If output derating applies, the acceptable operating envelope may narrow before conversion efficiency becomes the main concern.
Power factor should not be confused with efficiency. Efficiency compares real input power with DC output. Power factor describes how effectively AC voltage and current produce real power. Both influence facility design, but improving one does not mathematically guarantee a particular value for the other. Procurement data should retain both metrics and their load conditions.
What an 80 PLUS level does and does not establish
80 PLUS certification is useful evidence that a specific model met defined efficiency thresholds at specified load points and input conditions. Higher tiers can narrow the candidate set, and server-focused levels such as Platinum or Titanium are common reference points. However, the mark is not a promise that every point between the tested loads has the same efficiency, that the unit performs identically at another input voltage, or that the complete server power path has the module’s efficiency.
For readers comparing certification economics in a redundant deployment, the dedicated 80 Plus Platinum redundant server power supply analysis covers tier-related cost reasoning. A server PSU efficiency study should go one step further by using the certified model’s detailed curve or supported technical data at the deployment’s likely operating points.
Certification also does not replace platform compatibility. A highly efficient module that does not match the server’s mechanical envelope, blind-mate connector, firmware expectations, airflow direction, control signals, or supported-parts list is not a valid efficiency upgrade. Compare approved alternatives within the host platform’s documented boundaries.
Measure the installed server without confusing the boundaries
Module data supports screening; input measurement at the installed server tests the real assembly. For a controlled comparison, hold workload, firmware, fan policy, input voltage, ambient condition, and redundancy mode constant. Allow the system to reach a stable thermal state. Record AC real power and the server’s reported DC output or PSU telemetry, while noting the accuracy and update interval of each instrument.
Wall power includes more than PSU conversion loss. Motherboard voltage regulators, fans, storage, accelerators, memory, and management controllers all consume energy downstream. If two runs use different fan speeds or processor states, the difference cannot be attributed solely to the PSU. Likewise, summing telemetry values from multiple modules may not match an external power analyzer because the measurement boundaries and tolerances differ.
A useful result is not merely “this supply used fewer watts.” It identifies the workload, the number of active modules, their load fractions, AC input, ambient temperature, and measurement boundary. Those details make the result reproducible and allow operations teams to see whether a later firmware or configuration change has moved the fleet to another part of the curve.
Let the fleet load histogram choose the efficient module
The strongest efficiency choice is the approved PSU whose documented curve aligns with the server’s time-weighted operating profile while still carrying the required fault-state load. That may favor a lower-rated module for a lightly loaded compute node, or a larger high-efficiency module for a dense accelerator server. The answer can differ even when both servers have the same peak wattage.
At fleet scale, retain four pieces of evidence: a representative load histogram, model-specific efficiency data under relevant input conditions, annualized conversion-loss arithmetic, and the platform’s supported redundancy behavior. Together they turn server PSU efficiency from a badge comparison into a forecast of input energy and rack heat. The curve earns its value when it matches where the server actually operates—not where a brochure happens to print its largest percentage.